¶ View surveys in the Map
To view surveys in the Map, open the burger menu→ Map
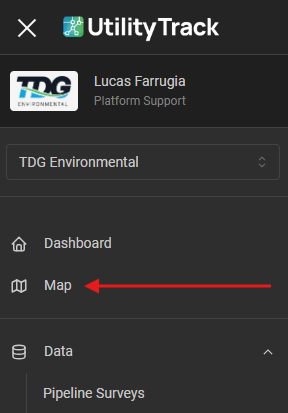
You will be presented with a view similar to the below.
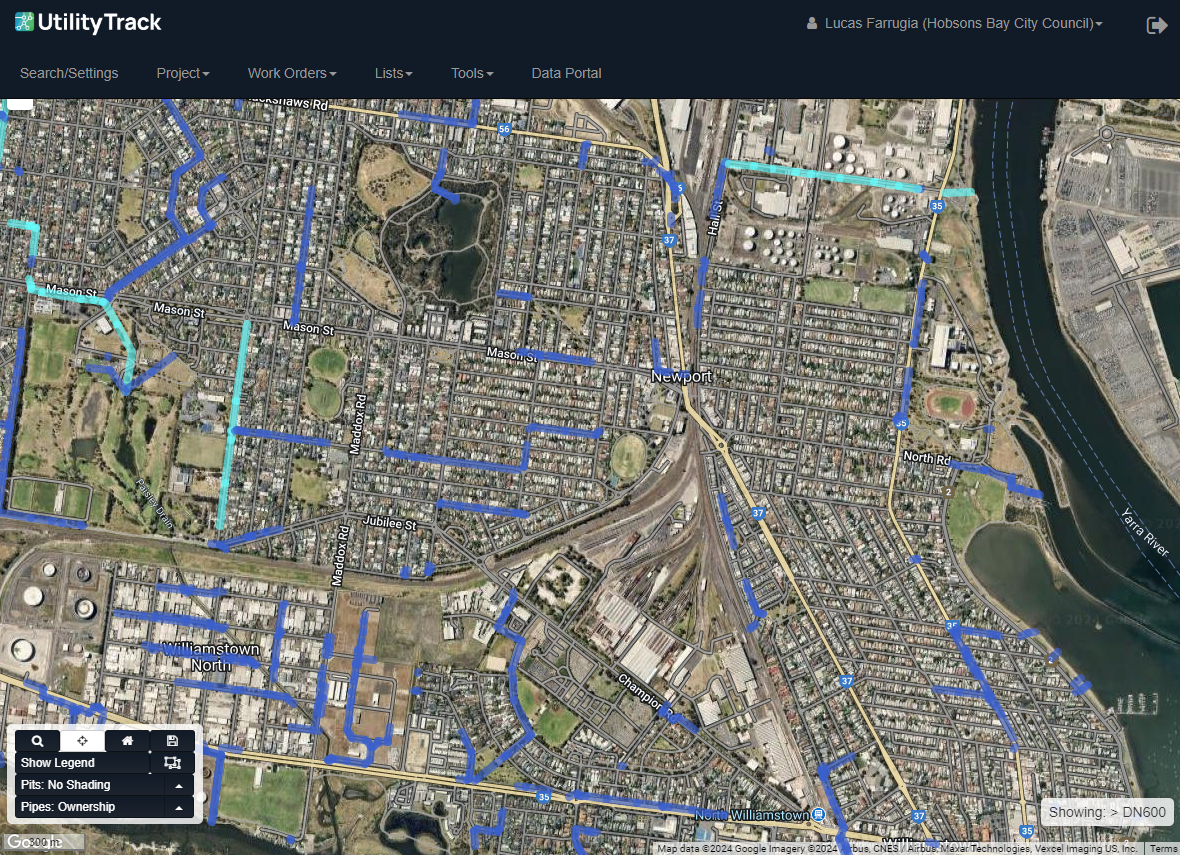
Next, we will search for the site where works are taking place. Start your search by clicking on the Search/Settings button at the top of your screen.
![]()
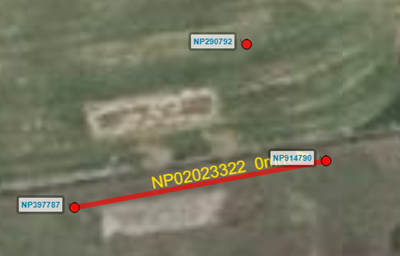
Start by typing in the address of the site you wish to view, or you can search by pipe/pit ID if these are known to you. Our system will attempt to show you possible results as you type.
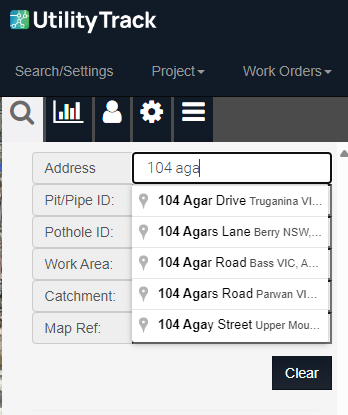

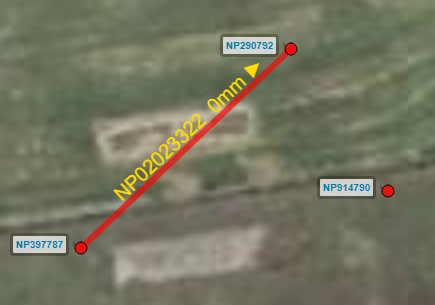
Clicking on a result will take you to the location associated with it.
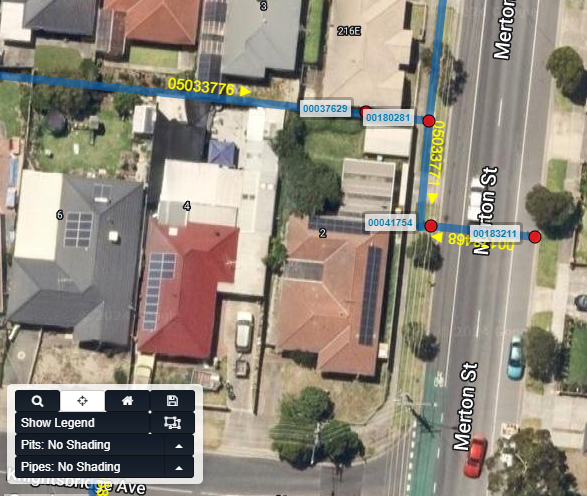
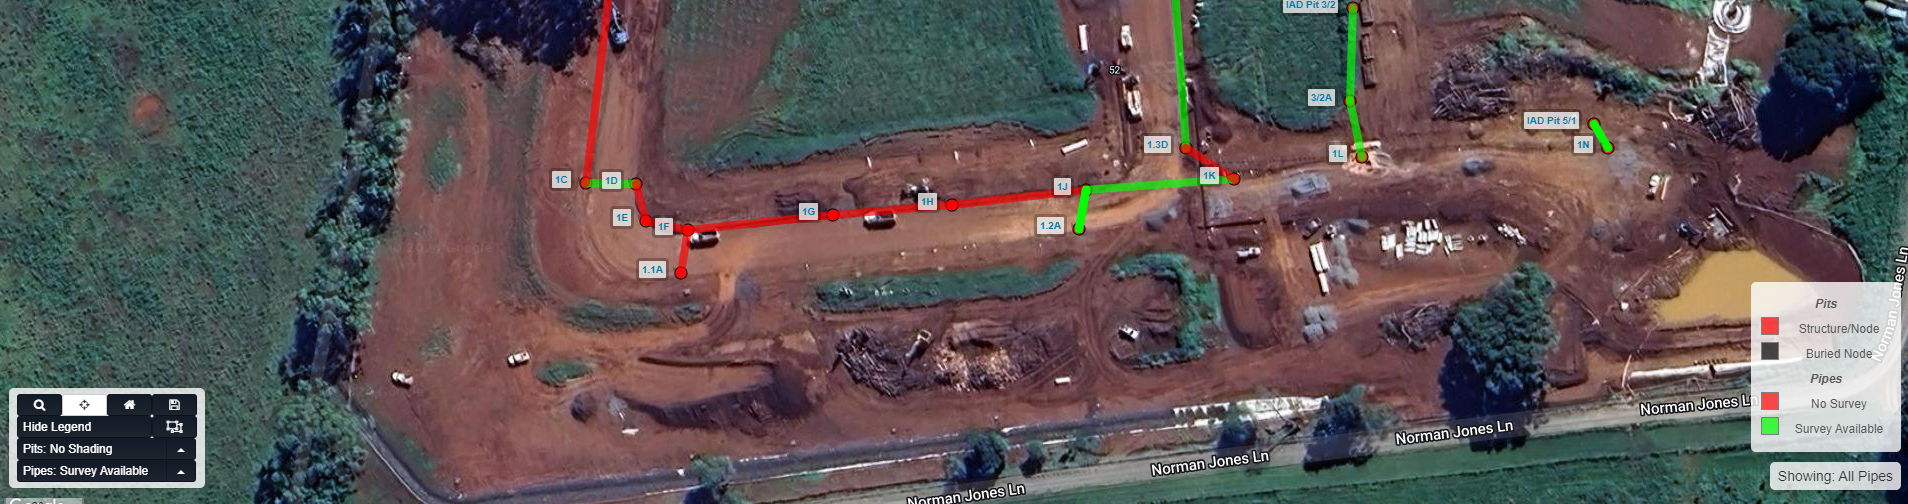
We can now click on pits or pipes to get information gathered in the field.
¶ Change map layers
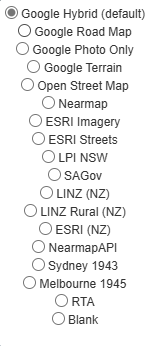
At the top right of our screen, we have the Map layer menu. We can utilise this to switch between the different layers available to us, this includes the default Google Hybrid (which is a satellite + road names view), Stormwater and Sewer (to view our plans overlayed and geo-referenced).

¶ Asset: Field
Functions used regularly for field activities such as taking photos/data, moving adding features.
¶ Take Data Form
Enter pit attribute data as per your organisation's specification.
¶ Record Works
¶ Snap Pipe

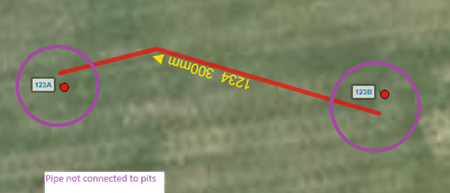
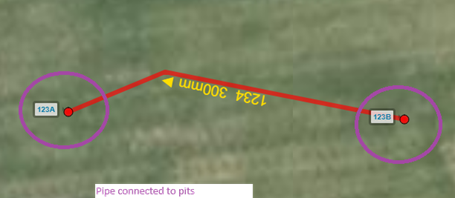
This tool snaps a pipe to the closest pits. This ignores the asset IDs and instead selects the physically closest pit to each end of the pipe. It will preserve any curves in the pipe.
This tool will also update both the Upstream and Downstream Pit IDs in the data, and recalculate the length of the pipe.
Snap Example
Before
After
If there is no pit at one end, do not use this tool. Add a pit or use Snap Upstream/Snap Downstream.
¶ Navigate to here
¶ Asset: Office
Functions used for admin and office-based task.
¶ Asset Info
¶ Add Job
¶ Show CCTV
¶ View PDF
¶ Save PDF
¶ Street View
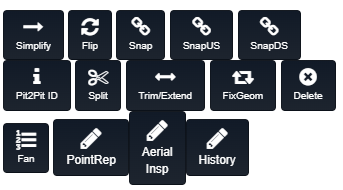
¶ Asset: Edit
The tools present within the map are to assist with the creation, modification, simplification or deletion of map assets.
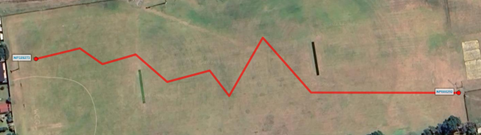
¶ Simplify Pipe

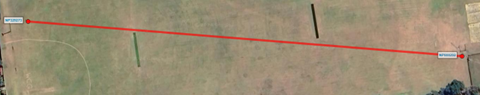
This tool removes all the bends from a line and makes it straight between the 2 pits. The length will be recalculated.
Before
After
¶ Flip Pipe

This tool changes the flow direction of a pipe; only the flow direction is reversed, and the geometric shape of the pipe remains unchanged.
Before
After
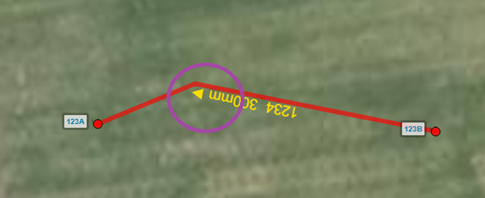
¶ Snap
This tool snaps a pipe to the closest pits. This ignores the asset IDs and instead selects the physically closest pit to each end of the pipe. It will preserve any curves in the pipe.
This tool will also update both the Upstream and Downstream Pit IDs in the data, and recalculate the length of the pipe.
Snap Example
Before
After
If there is no pit at one end, do not use this tool. Add a pit or use Snap Upstream/Snap Downstream.
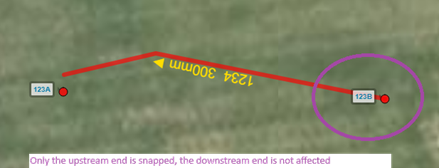
¶ Snap Upstream

This tool is similar to the snap tool, but it only updates the upstream end of the pipe—meaning it snaps the upstream end to the nearest pit, updates the upstream pit ID and geometry, and recalculates the pipe length, while the downstream end remains unchanged. (The upstream end is where the pipe begins, and the downstream end is where it finishes; this is useful when there is a pit at one end of the line but not the other).
Before

After
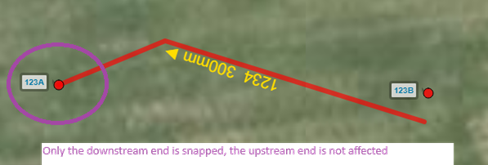
¶ Snap Downstream

This tool is useful when there is a pit at the downstream end of the pipe but not at the upstream end, or when you need to correct the pipe’s connection for accurate mapping and data integrity.
Before

After
¶ Pit to Pit ID

This tool is intended to make asset IDs for new estates look better.
Pipe IDs are rarely supplied on face plans (usually only pit IDs), so when pipes are drawn in they typically have a generated asset number.
Clicking this tool will rename the pipe with an asset ID of
[From Pit ID]-[To Pit ID]
Before
After
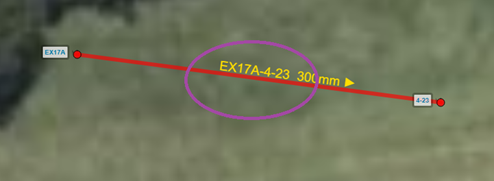
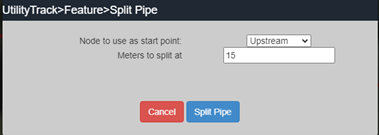
¶ Split Tool

This tool is used to split a line. Say for example, you are surveying a pipe from the upstream node, that is 20m long, and you find a buried pit at 15m.
Example
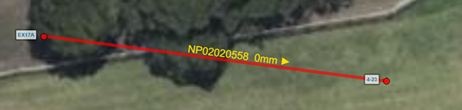
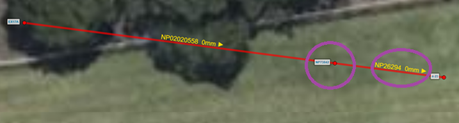
The tool will plot a new pit at 15m from the start of the line, and split the line so the first segment is 15m. The guid on the first section will be preserved, so the current survey will be attached to that line, and you can:
- add code “GC – Line not to plan, unmapped node found”
- add code “FHxx – Finish Node”
Then start a new inspection for the next section.
Before
After
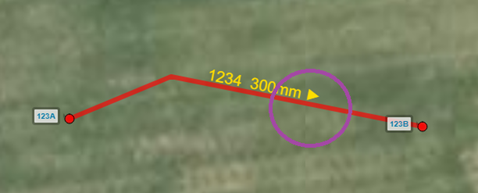
¶ Trim/Extend

This tool sets a line (grows/shrinks) to a specific length. It’s intended use is to set a line to a length matching the CCTV where the pit cannot be seen on the aerial photo. Note, pits need to be adjusted independently. Due to the maths involved there will always be a very slight error (e.g. 20m might show up as 19.9m).
Before
After
¶ Fix Geometry

Sometimes pipes will get a corrupted geometry, or a bad length.
This tool will recalculate the length and fix the geometry object.
It’s normally used where the length looks way off (e.g. pipe reports to be 100m, but looks like it should be 5m)
¶ Delete Pipe

It removes a pipe from the map.
Note: the pipe is not fully deleted but placed in a ‘Recycle Bin’. If deleted in error, Admin can restore.
Before

After
¶ Fan Pipe (Multi Cell Maker)
.png)
This tool draws evenly spaced parallel lines. It is used when there is a twin cell pipe or multicell culvert to draw the lines in neatly.
If the size and material are filled in before the line is fanned, then these attributes will be copied to all new segments. The original segment will be made into the center (for odd numbers) or top/left most line for odd numbers and will keep its ID. NP IDs will be generated for the other lines.
Before
_before.png)
After
_after.png)
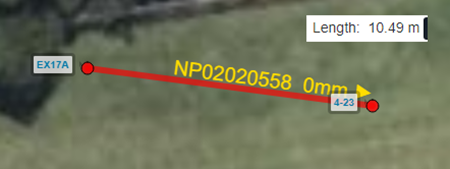
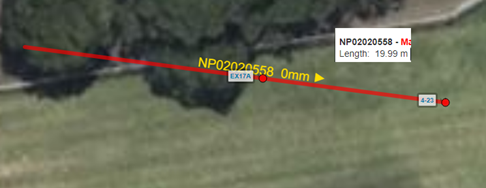
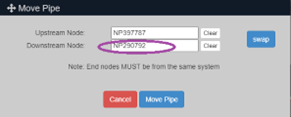
¶ Move Pipe

This tool moves a pipe between two known asset IDs
Example
Before
After
¶ Asset: Comments
Comments made against an asset (only shown if there are comments).
¶ Asset: Jobs
Open Jobs (only shown if there are open jobs).
¶ Asset: History
Closed Jobs.
¶ Mouse Tools
When right clicking with our mouse on any part of the map that is not a pit or pipe, we receive the following menu.
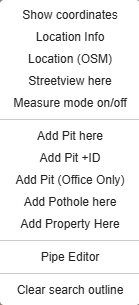
The menu is explained below.
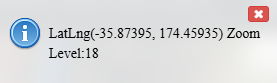
¶ Show coordinates
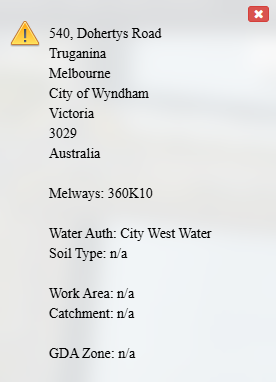
¶ Location Info
This provides an overview of information on a location such as the Adress, Council, State, Melways reference, Water Authority etc.
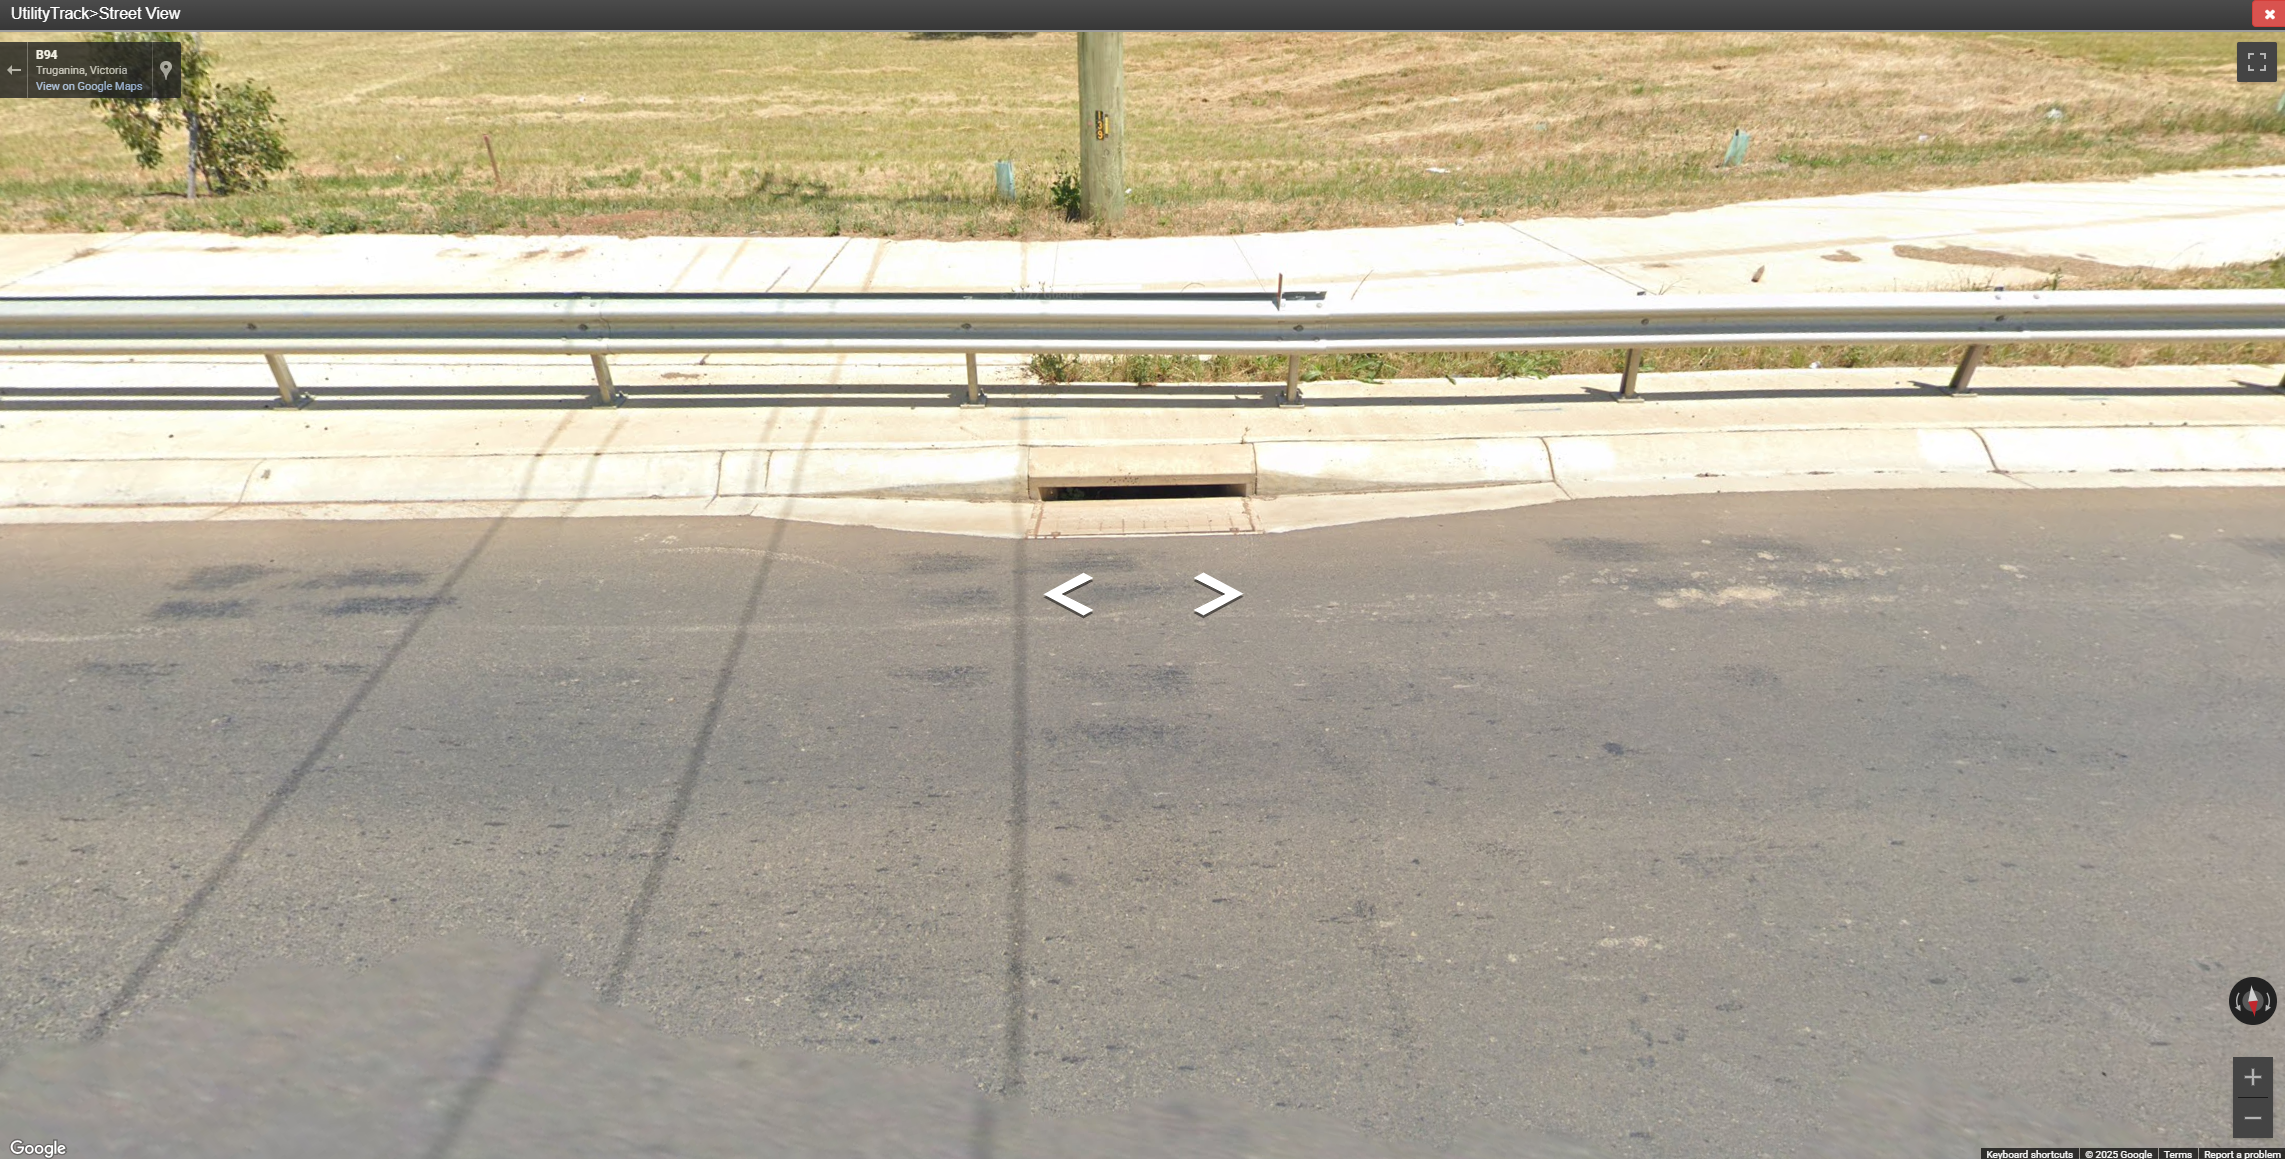
¶ Street View Here
This will open a Street View of the selected location.
¶ Measure mode on/off
Click to start settings points for measurement, press escape to remove.
¶ Add Pit here
Will add a pit at the mouse cursor with a randomly generated ID.

¶ Add Pit +ID
Will add a pit at the mouse cursor, and open the rename menu immediately afterwards.
¶ Add Pit (Office Only) - WIP
¶ Add Pothole here
Will add a pothole at the cursor.
¶ Add Property Here - WIP
¶ Pipe Editor
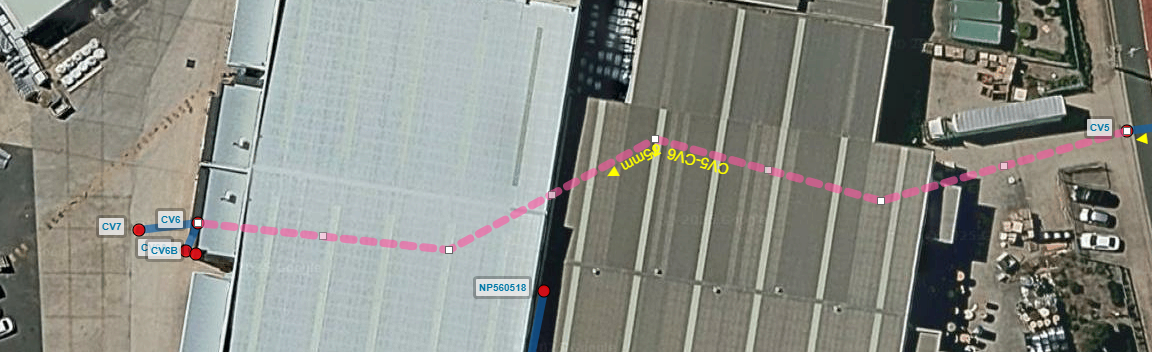
The pipe editor allows us to edit the path of a pipe between two pits. The red 'x' cancels any edits present. The blue crossed-arrow allows us to pan around the map while in the edit mode. The blue floppy disk icon allows us to save our edits, our edits are not saved without this button being pressed.

A pipe in edit is represented by the pink dashed pipe.
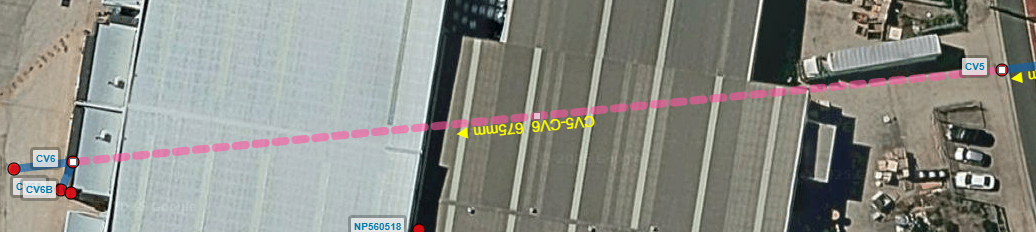
We can edit the white points by clicking and dragging them, this will in turn add more points between the set of white points. This gives us fine control over the curve/path of a pipe.
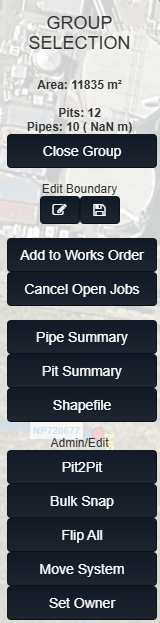
¶ Group Selection tool

The group selection tool allows us to create Work Orders, Cancel Open Jobs, get Pipe/Pit Summaries, and Shapefiles.
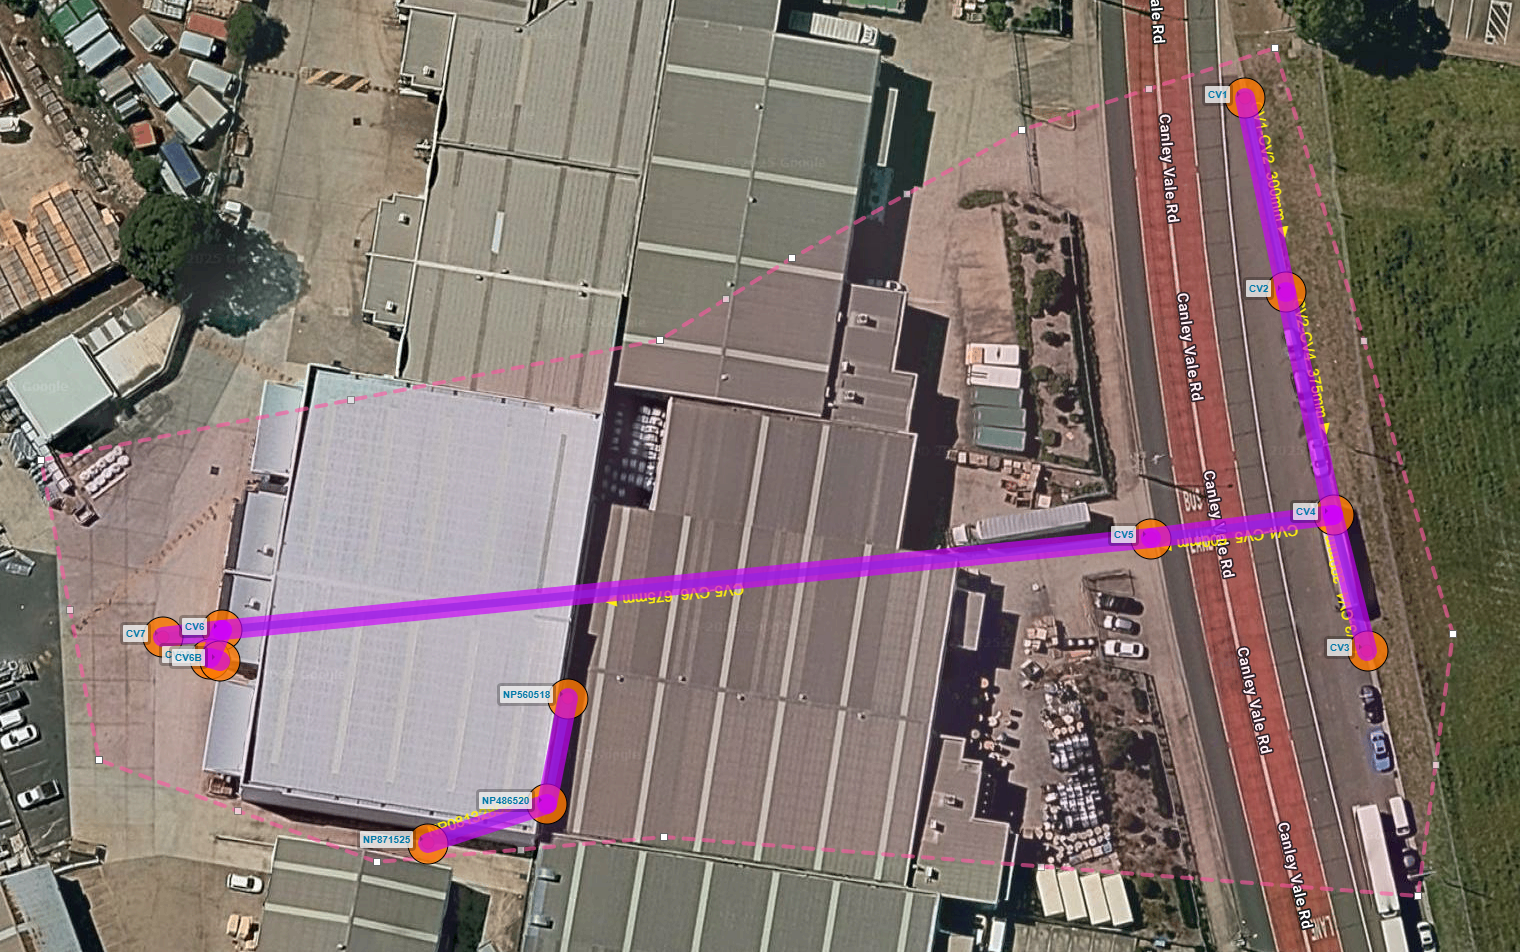
After clicking on the Group Selection tool, your cursor will change, and upon clicking will start to draw polygons connecting to the points created when clicked. To close the polygon selection, double click, it will now turn purple.
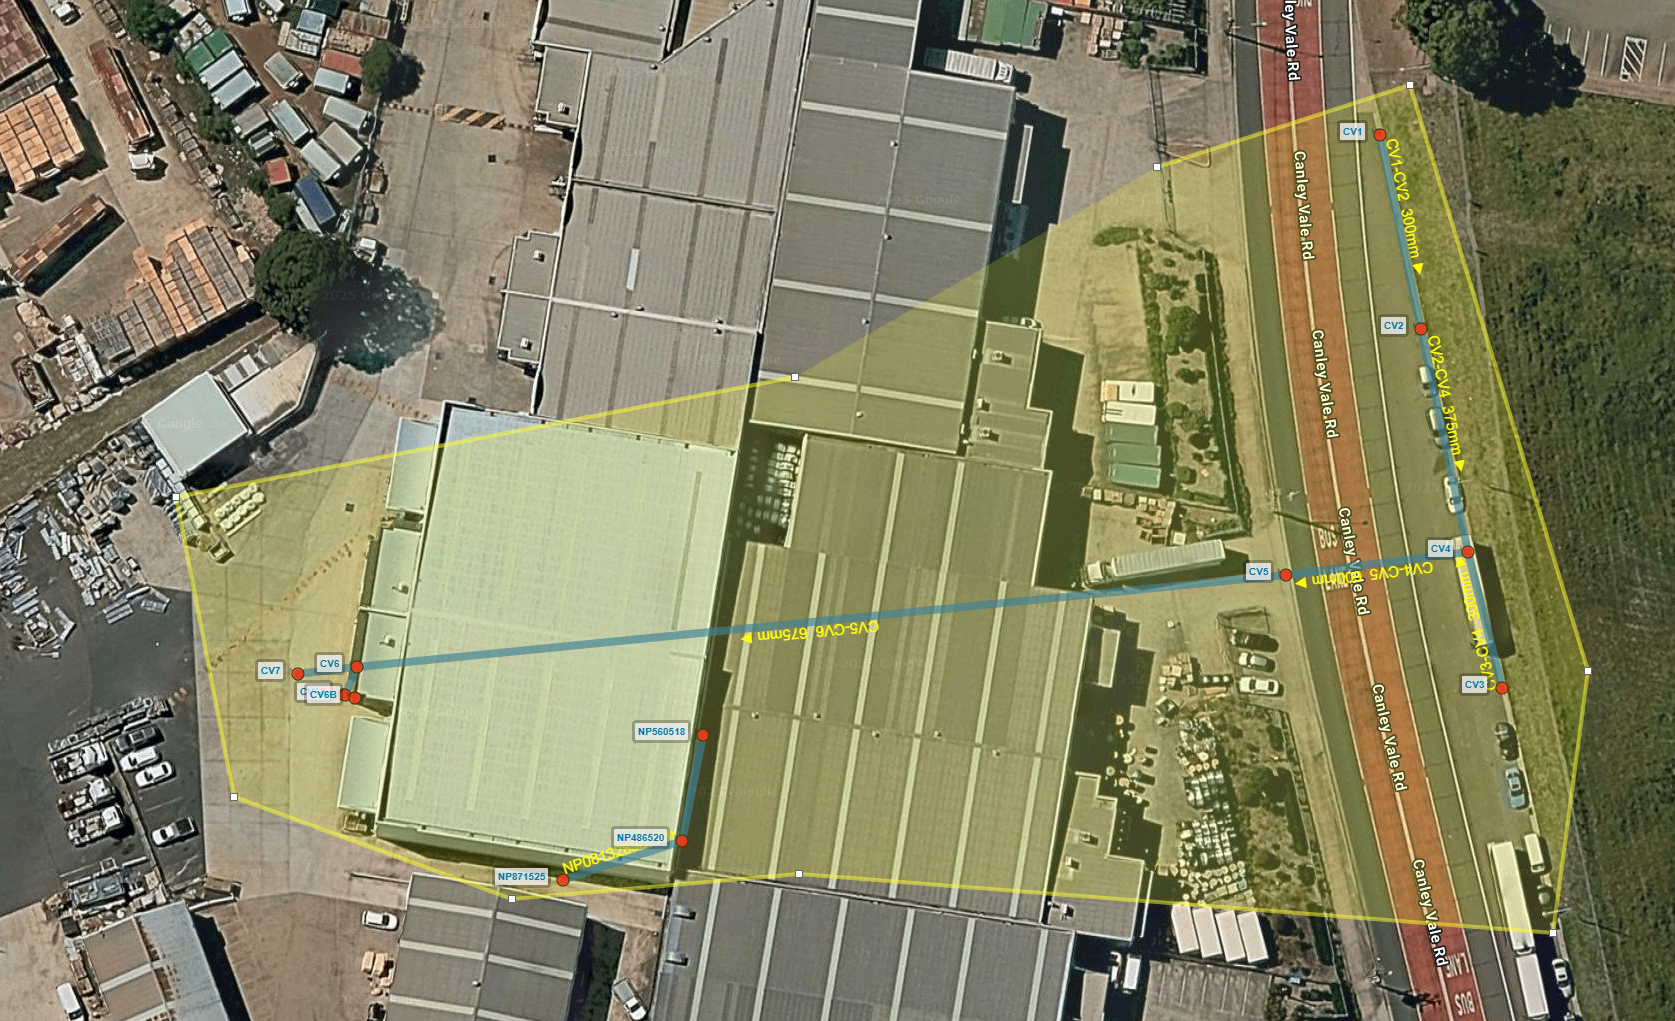
This is a selected group. We can now Add to Work Orders and get information on the pits/pipes in the selection.
These are the options available to us.
¶ Pit/Pipe Shading and Legend
At the bottom left-hand corner, we have our shading options. These act as a filter and allow us to view our information in different ways.
¶ Show Legend
The 'Show Legend' button enables a Legend overlay in the bottom right corner to show what each colour of your current view relates to within UtilityTrack.

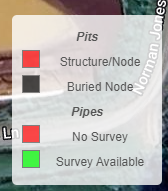
This is important especially when changing the active shading.
¶ Pits Shading options:
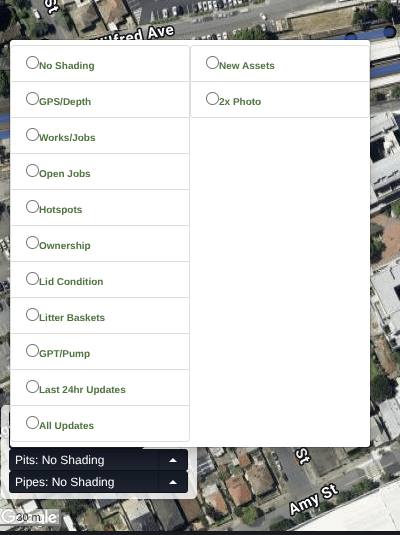
No shading - no shading
GPS/Depth - shows status of pipes whether we have SL (Surface Level), Depth, no data or it's buried, and whether pipe is a channel or pipe
Works/Jobs - shows job status for pits
Open Jobs - shows pits with open job
Hotspots - highlights pits that have been placed into a grouping with a need for frequent inspection
Ownership - colour coded by owner
Lid Condition - condition of lids
Litter Baskets - whether or not pit has basket
GPT/Pump - nodes that are pumps/gpts
Last 24hr - any pit that has an update in last 24hr
All Updates - any pit that has been updated in UT
New Assets - assets added to UT since asset owner data import
2x Photo - pits with 2 or more photos
¶ Pipe Shading options:

No shading - no shading (default)
CCTV (by FY) - colour code pipes by year CCTV recorded (if available data)
Brick Drains - highlights brick drains
Brick by FY
Survey Available (Last 18m by capture date)
Survey Available (all time)
Video Available (all time)
Structural Condition - shows colour coding lines based on structural condition where data is available
Structural 4s and 5s shows high risk pipes with 4 or 5 rating
Service Condition (shows colour coding lines based on serviceability of pipe where data is available)
Service 4s and 5s shows high risk pipes with 4 or 5 raiting
Rehab candidates - Shows pipes flagged for review
Rehab current year - same but for current year (confirm with kirk)
Open Jobs (CCTV) - shows all pipes with open CCTV jobs
Open jobs (Combo) - shows all pipes with open Combo jobs
Open Jobs (Robot) - shows all pipes with open Robotics jobs
Work Order - Opens the work order selector allowing user to select a work order from list and zoom to/filter to only show that work order
Work Order (Legacy) - Same but slightly different (confirm difference with kirk)
Works/Jobs - shows pipes with jobs associated and their status
Ownership - Who owns the pipe
New Assets - assets added to UT since asset owner data import
Last 24hr - assets updated in last 24hrs