¶ Welcome
Welcome to the UtilityTrack platform.
UtilityTrack is a cloud-based GIS platform designed for managing underground infrastructure (particularly stormwater and sewer assets) across Australia and New Zealand. It allows teams to:
- Map, view, and edit asset layouts.
- Collect and review field data (e.g. condition surveys, CCTV footage).
- Track asset condition, jobs, and inspection history.
- Collaborate in real-time between office and field staff.
Accessible via desktop, tablet, or mobile.
To help familiarise you with your account and the platform, we've developed this short guide.
If you have any issues, please open a ticket and our team will be able to assist you with logging in and gaining access to the platform - UtilityTrack Support
¶ Your Dashboard
This document provides a comprehensive overview and statistical summary of the work completed to date. It offers quick access to key sections, including 'CCTV Surveys,' 'Work Orders,' and 'Recent Observations,' to name a few.
Navigation within UtilityTrack is facilitated through the burger menu, which enables efficient access to specific projects, details of completed and ongoing work, surveys, and the generation/export of reports.
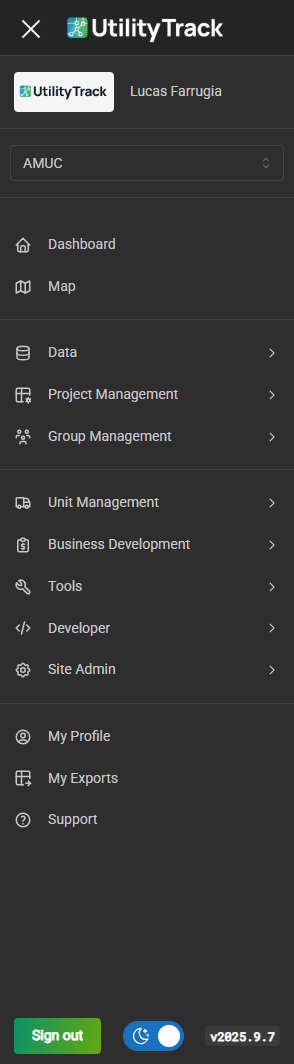
¶ The Burger menu 

The Burger menu is our navigation bar, it allows us to open and close the navigation bar which is the main vehicle we use to take us to the different parts of UT.

To open the menu, press this icon:
To close the menu, press this icon:
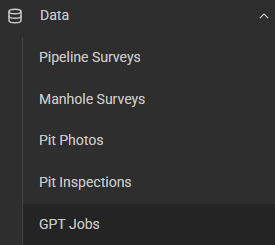
Your navigation bar will look similar to this (depending on access level):
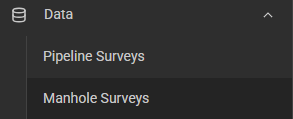
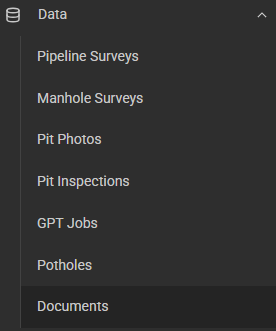
Data refers to the information stored within UtilityTrack. This information may be represented in various forms, including but not limited to:
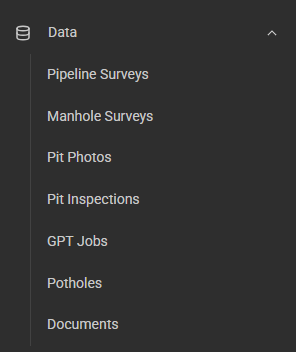
- Pipeline Surveys: Data relating to surveys within the chosen System (CCTV, Structural Grade/Score, Status etc)
- Manhole Surveys: Data relating specifically to Manholes (Sewer)
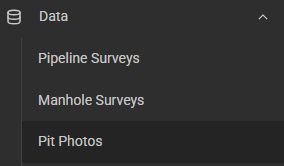
- Pit Photos: Photos taken of Pits captured within the System
- Pit Inspections: Data recorded against Pits within the System
- GPT Jobs: Data recorded against GPT (Gross Pollutant Traps)
- Potholes: Data recorded against Potholes
- Documents: Plans or other documents added to the System
We will cover these in further detail below.
¶ Pipeline Surveys
¶ Date Range
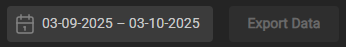
Surveys are displayed using a date range, this way we show you the data you need. To change the date range, click on it, select your start date, and your end date.
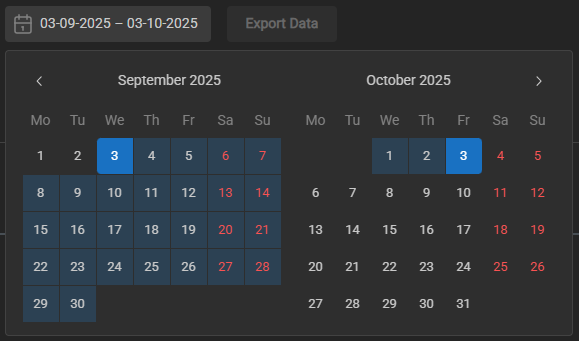
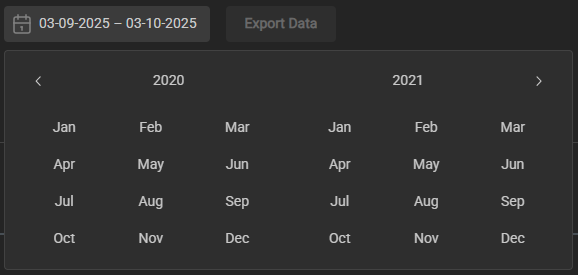
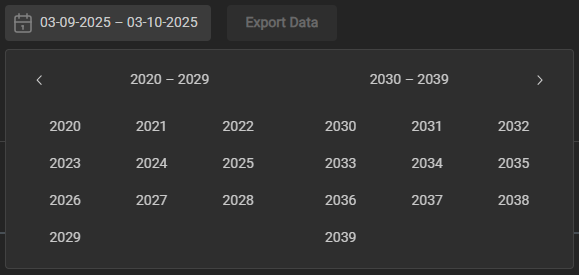
If you're not in the correct month or year, you can change this by clicking on the month / year, which will bring you to a selection of months and years to choose from.
Once open, we can now select a start date, and an end date for our search.
¶ Search
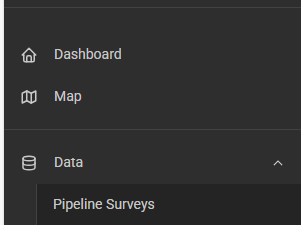
To search for a specific asset, we want to navigate to the Data → Pipeline Surveys area.
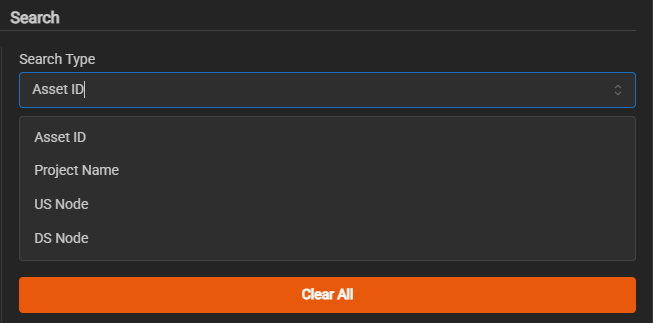
From here we can use the configurable search bar located at the top right hand side
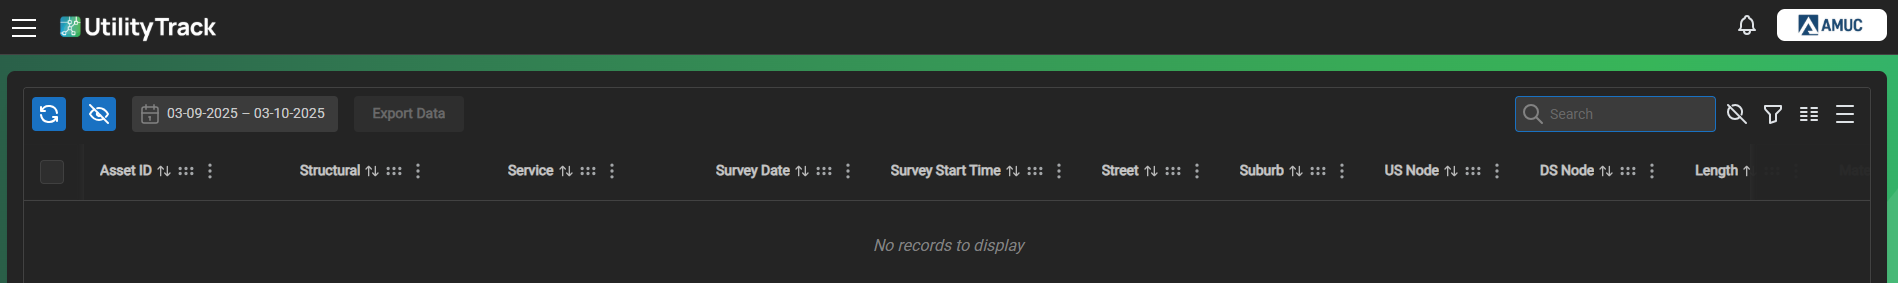
If your search bar is missing, please click the show/hide search bar button

From here, we can type in the name of the asset, work order, project name etc. that we are searching for.
¶ Search Filters, Table Density and Customisations
In UtilityTrack we have the ability to customise and adjust our table, filters and search. From left to right, we have:
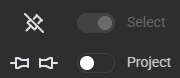
- Show / Hide Search Bar
- Show / Hide Filters
- Show / Hide Columns
- Toggle Density
¶ Show / Hide Search Bar
This button will show or hide the search bar depending on the current state of it.
¶ Show / Hide Filters
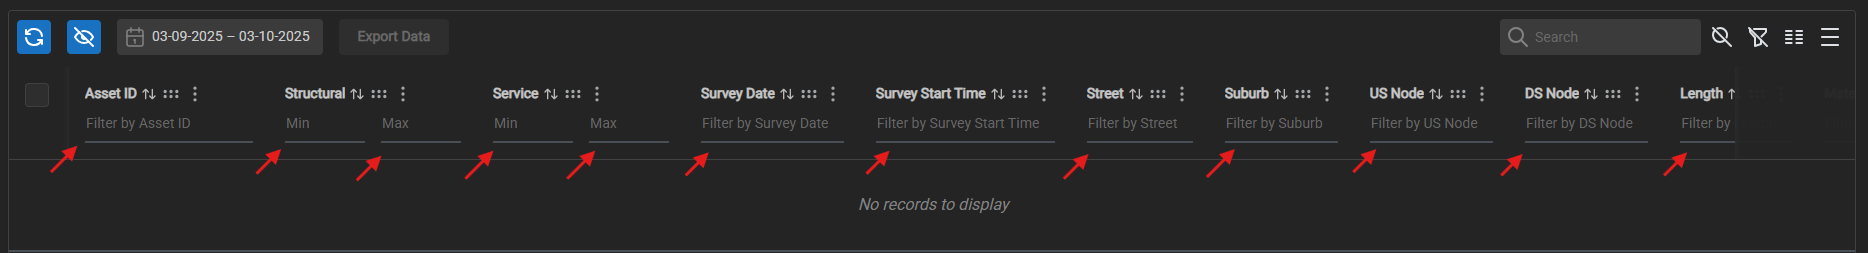
This button will show or hide the Filter options beneath each column, type to filter.
¶ Show / Hide Columns
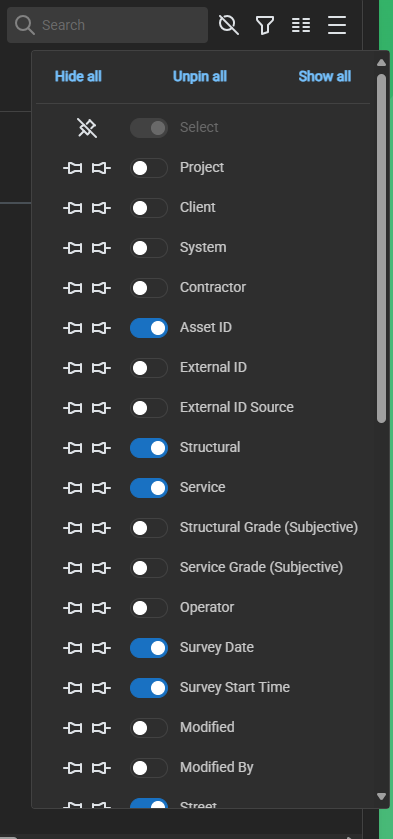
This Button will show or hide the Column panel, which enables you to show or hide different columns with the toggle button, as well as pin to the left or right the different columns.
¶ Pinning
Pinning will enable those columns to be visible regardless of how far you scroll across the table.
¶ Toggle Density
Pressing this button will toggle between the different densities of row compaction. The more dense it's set to, the closer your rows are together, the more rows can be fit on the screen at once.
Comfort

Semi-Dense

Dense

¶ Filter Panel
To filter by Work Order, Financial Year, Current year etc. we utilise the Filter Panel.
Find the Filter Panel located at the bottom-right corner of your window.
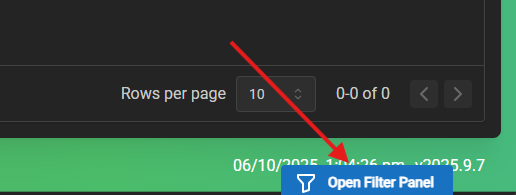
Open the Filter Panel
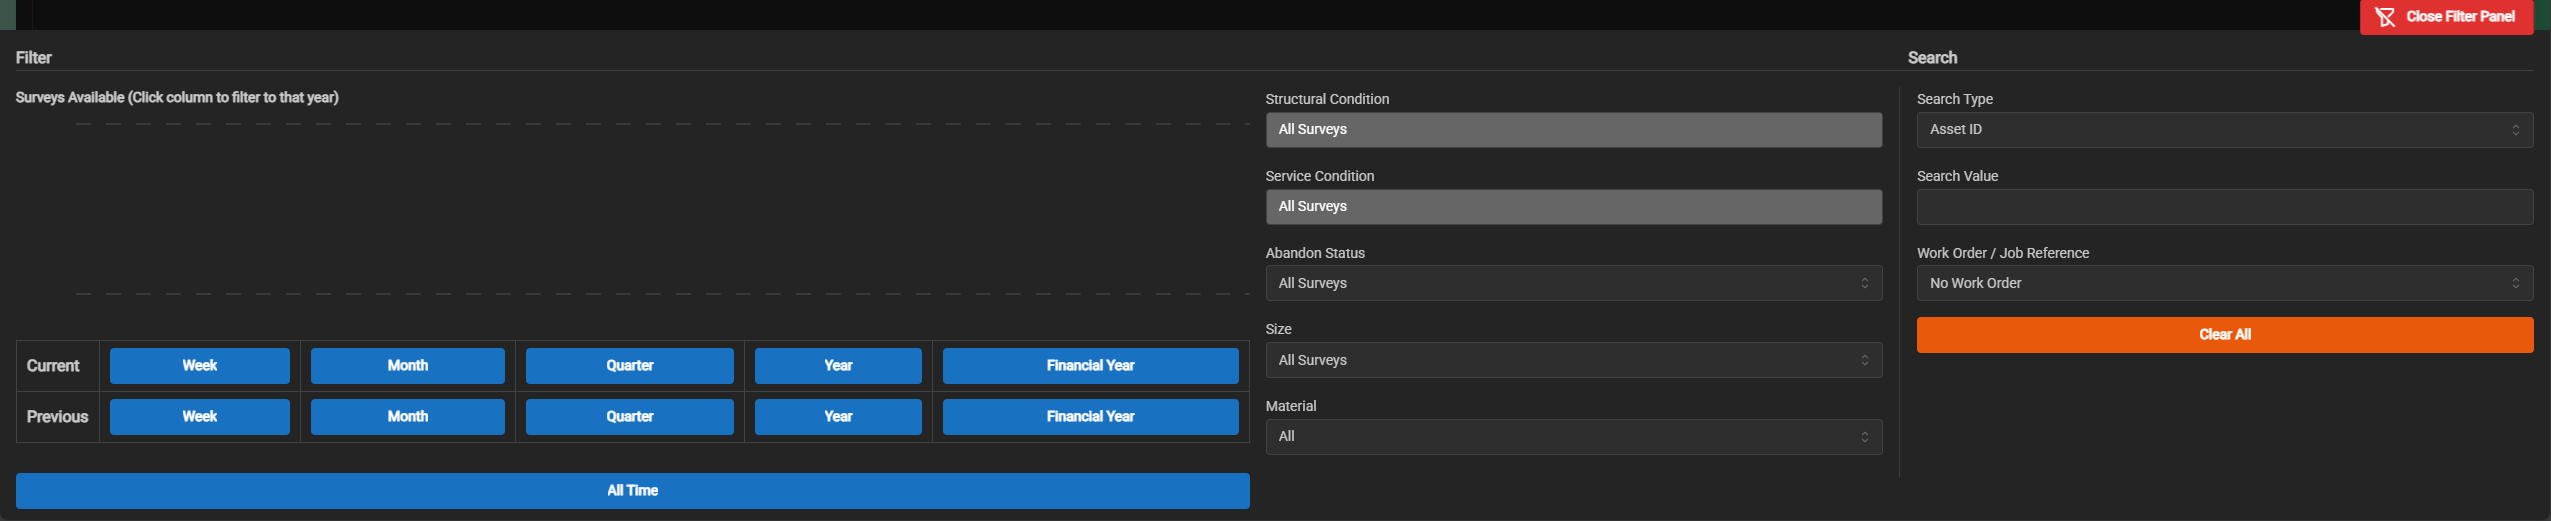
We have a variety of options to filter our surveys. The below buttons filter by the Current: Week / Month / Quarter / Year and Financial Year.
Below are the same options for the previous variant.

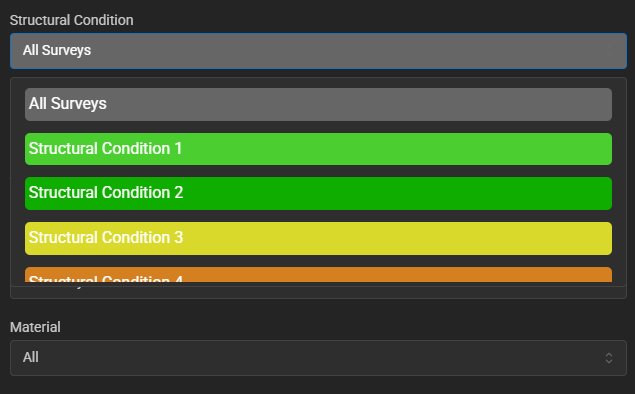
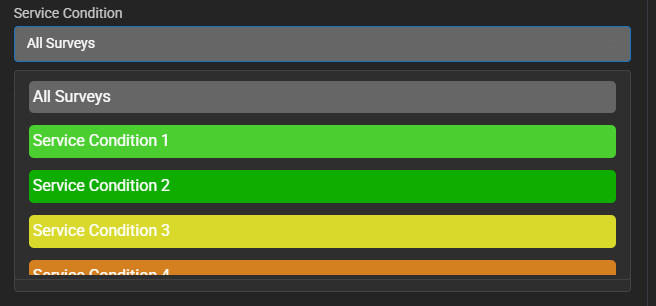
We can filter by Structural Condition Score.
We can filter by Structural Service Score.
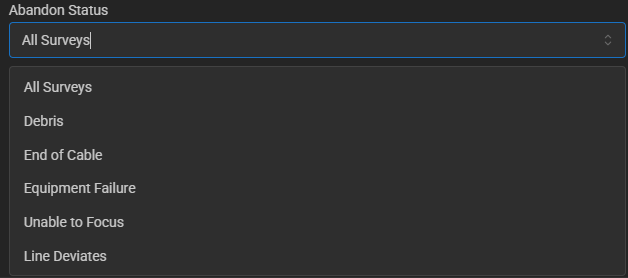
We can filter by the Abandon Status.
We can filter by the Pipe Size Diameter.

We can filter by the Pipe Material.

We can filter by the Asset Type.
We can filter by the Work Order.

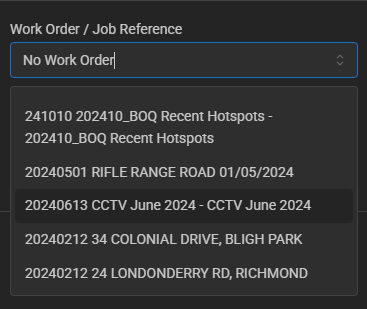
To select a Work Order to filter by, select an entry to change the active Work Order from the list.
Once the active Work Order is selected, the Filter Panel can be closed by clicking the Close Filter Panel button (red) or by clicking on the defocused UT screen.
Next, we will proceed to view the survey videos.
¶ Viewing Surveys in UtilityTrack
Surveys within the parameters you have set will now be visible within the table.
¶ View a Survey video
To view a survey, click on the Video icon located at the right end of the row corresponding to the survey you wish to view.

This is the Survey View, from here we can view the survey, as well as any observations present.

¶ Viewing Observations
At the bottom left, we have access to the 'Show Observations' panel. This panel contains a visual representation of all observations recorded in the survey.
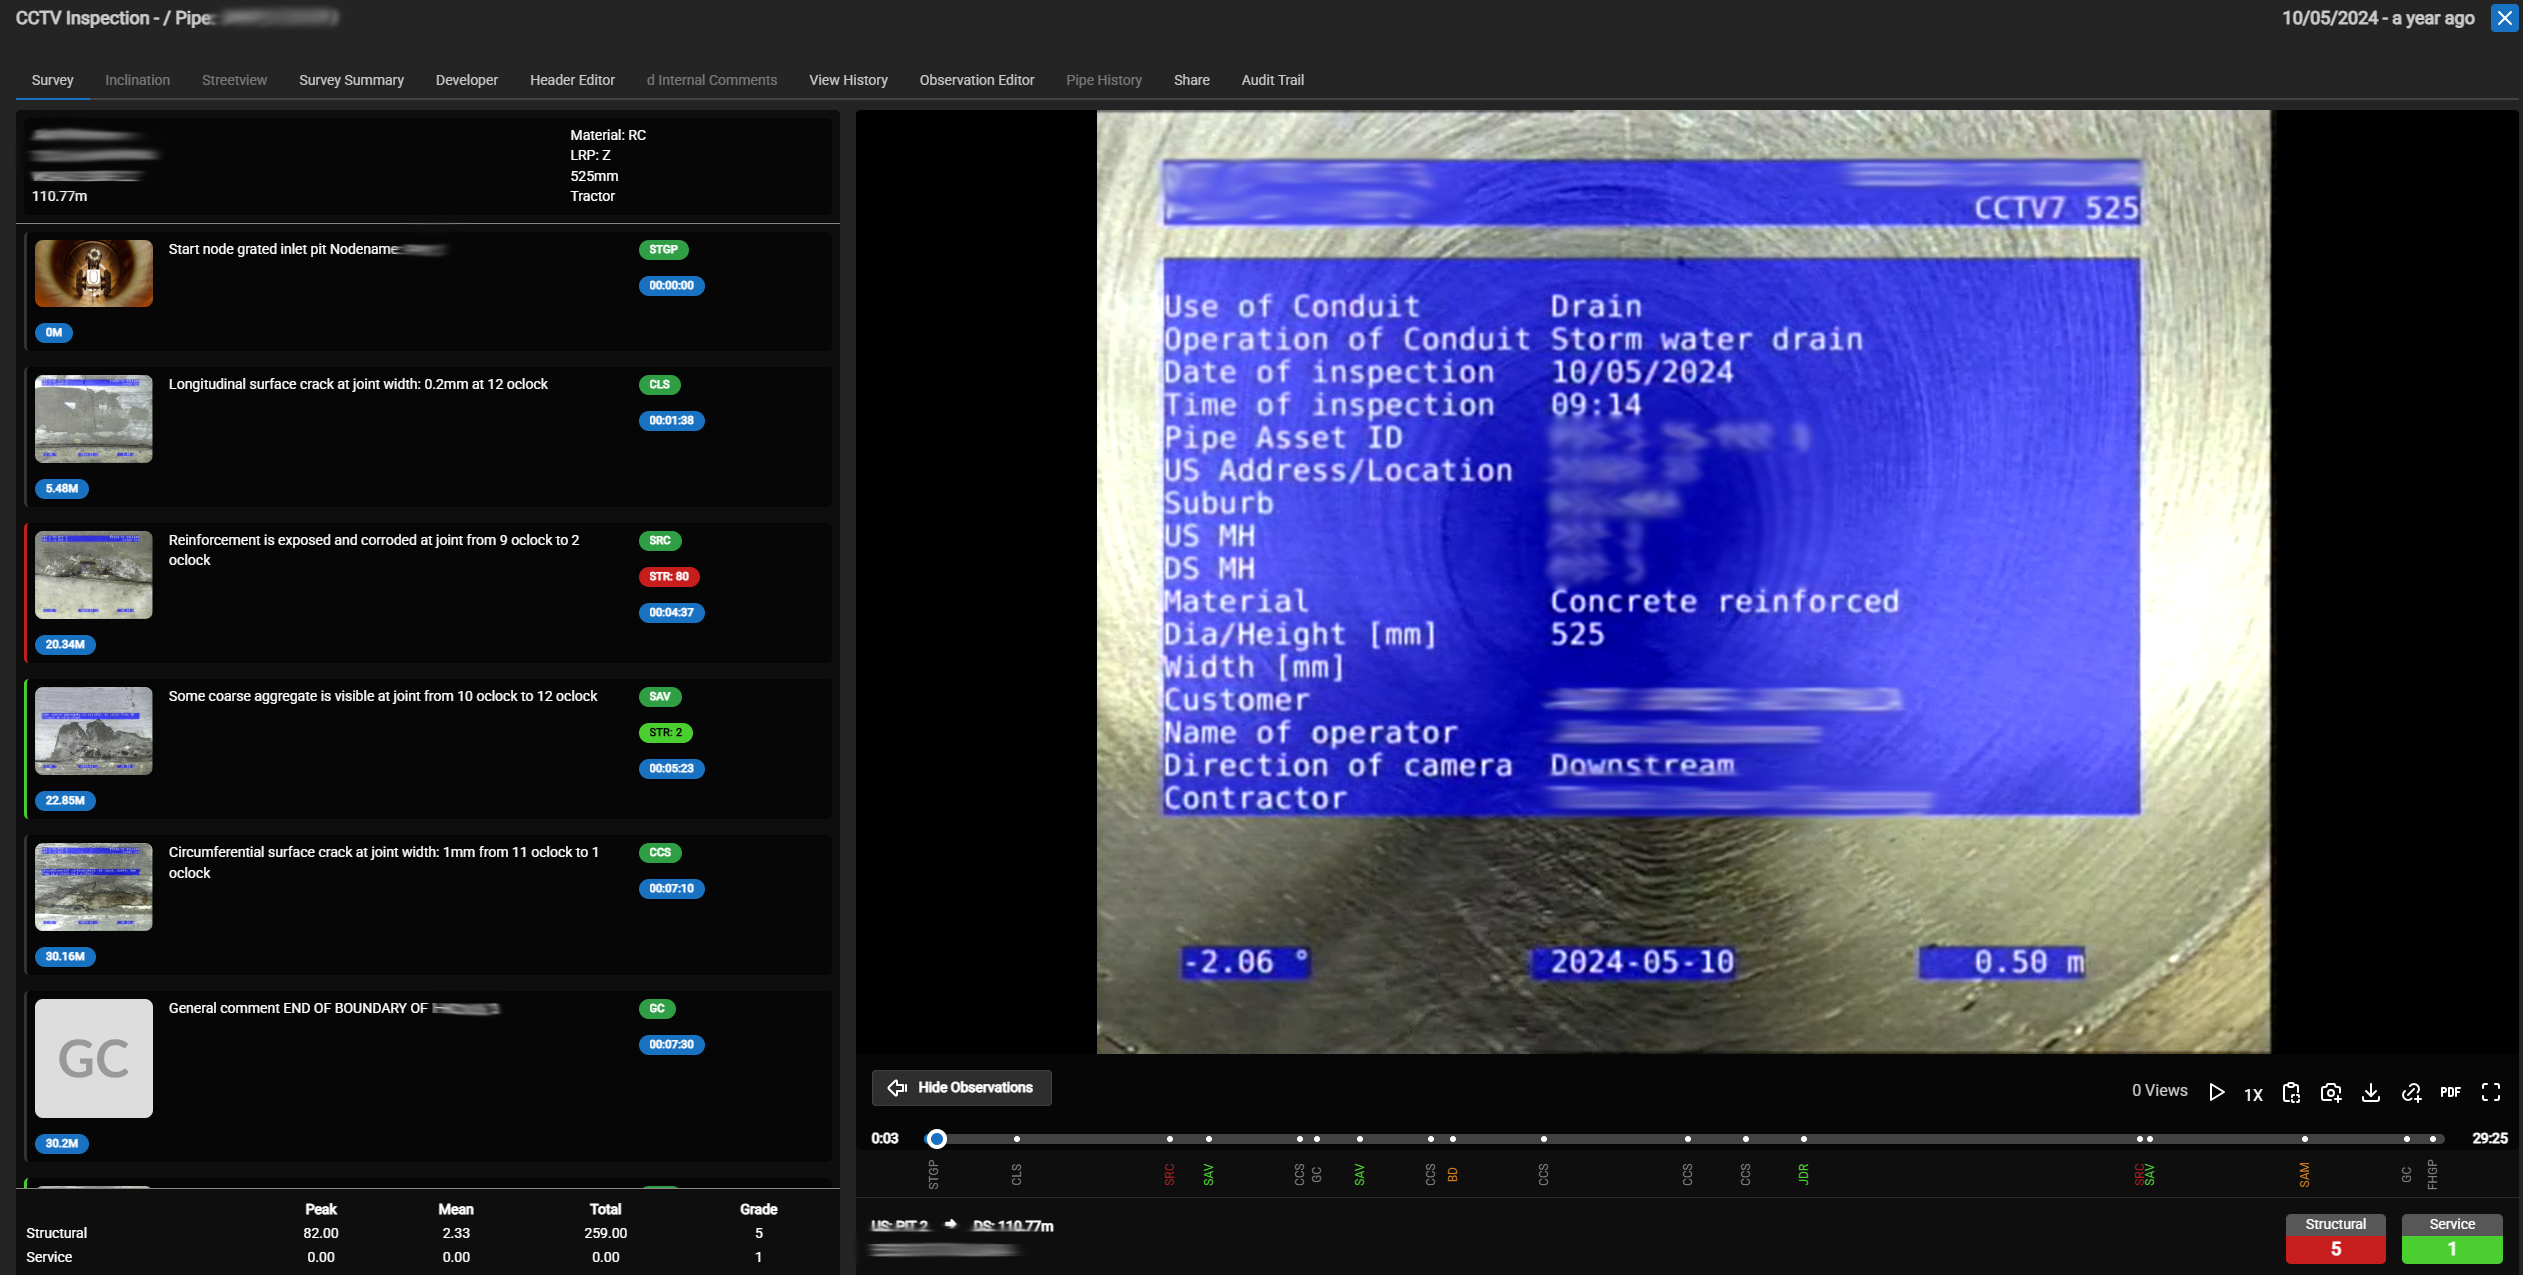

From here, we can click on each timecode for the observation to skip to that point in the survey.

¶ Generating and Exporting Reports
If you require an export of all current surveys for your System, please lodge a ticket with our team at https://support.utilitytrack.com.au/
To generate / export a report, open the burger menu and click on Pipeline Surveys.
Next, we want to select the surveys we wish to export or include in our report. We do so by utilising the check boxes on the left-hand side of our table.

Let's go ahead and click on Export Data.

¶ How to export
By default, we include the Survey Datasheet, this is a spreadsheet with all the survey data for the selected surveys.
From here, we can choose to add or remove options from our export.
Listed in order, our options are:
Media
-
Include Videos
Add the videos for the selected surveys
Spreadsheets
- Include Survey Spreadsheet
- An xlsx file with all the survey data for the selected surveys
- Include Survey Observation Spreadsheets
- An xlsx file with all the survey observation data for each of the selected surveys
- Include Rehabilitation Recommendation Spreadsheet
- An xlsx file with all the rehabilitation recommendation data for each of the selected surveys - does not include observations that do not have a rehabilitation recommendation
Reports
-
Include Individual Reports
- A PDF for each survey
-
Include Combined Report
- A single PDF with all the individual reports combined
Spatial Exports
Only surveys that have been spatially located will be included in the spatial exports
- Include GIS Data Export
- A zip file containing the features in GIS application format
- Include Observations
- Observations will be included in the GIS data export
- Include Line
- Line data will be included in the GIS data export
Spatial Exports - Files
Preferred Format
- ESRI Shapefile
- The shapefile format is a geospatial vector data format for geographic information system (GIS) software, developed and regulated by ESRI.
- Mapinfo Tab
- The MapInfo TAB format is a geospatial vector data format for geographic information systems software. It is developed and regulated by Precisely as a proprietary format.
- KML
- Keyhole Markup Language is an XML notation for expressing geographic annotation and visualization within two-dimensional maps and three-dimensional Earth browsers. KML was developed for use with Google Earth, which was originally named Keyhole Earth Viewer.
- AUTOCAD DXF
- AutoCAD DXF is a CAD data file format developed by Autodesk for enabling data interoperability between AutoCAD and other programs.
Preferred EPSG
Relevant to geodetic datums in use for Projections
Export Summary
This is where a summary of your currently selection options are provided to you for review before exporting.
And now we press Export.
¶ Accessing our files
We should now have a zipped/compressed/archived folder; to access the files inside, we have to unzip/decompress/unarchive the folder. We do so by right clicking on the folder and clicking "Extract All..."; this method will work for most Windows based Operating Systems.

For users on Windows 11, you may simple double click to open the folder, and drag your files out of it, or use the "Extract All" button from the window.
Either way, when using the ""Extract All" method, you will be presented with this window.

Browse to where you'd like the folder extracted to, and if you like, choose the option to "Show extracted files when complete" option to automatically open the folder once the extraction is complete. When ready, click "Extract" to continue.
You now have your files and reports ready to use.
Including videos will increase the time it takes to generate, please be patient. Multiple surveys with videos can affect the delivery time of your files, resulting in a link being sent to you for download instead of downloading them through your browser.
¶ Manhole Surveys
Data → Manhole Surveys
Manhole Surveys utilises the same system as the Pipeline Survey view. Please refer to the above instructions on how to navigate and use the view.
¶ Pit Photos
Data → Pit Photos
In this view you're able to view and download Pit Photos utilising either the checked menu on the left, and clicking the Download Selected button, or the elipses on the right side of the row and selecting View Linked Photos.
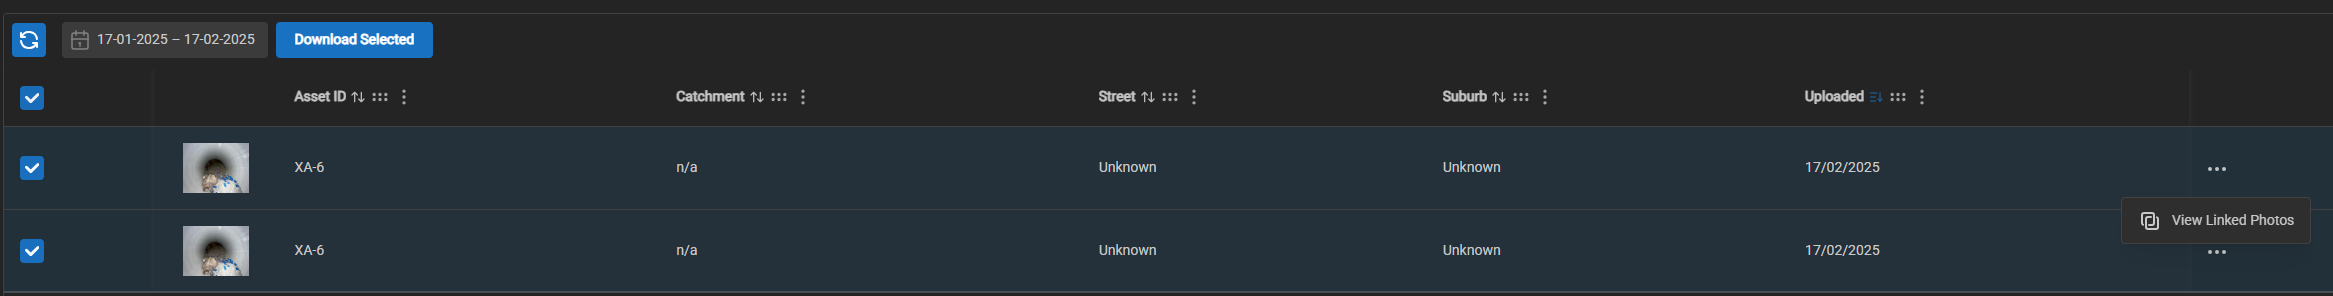
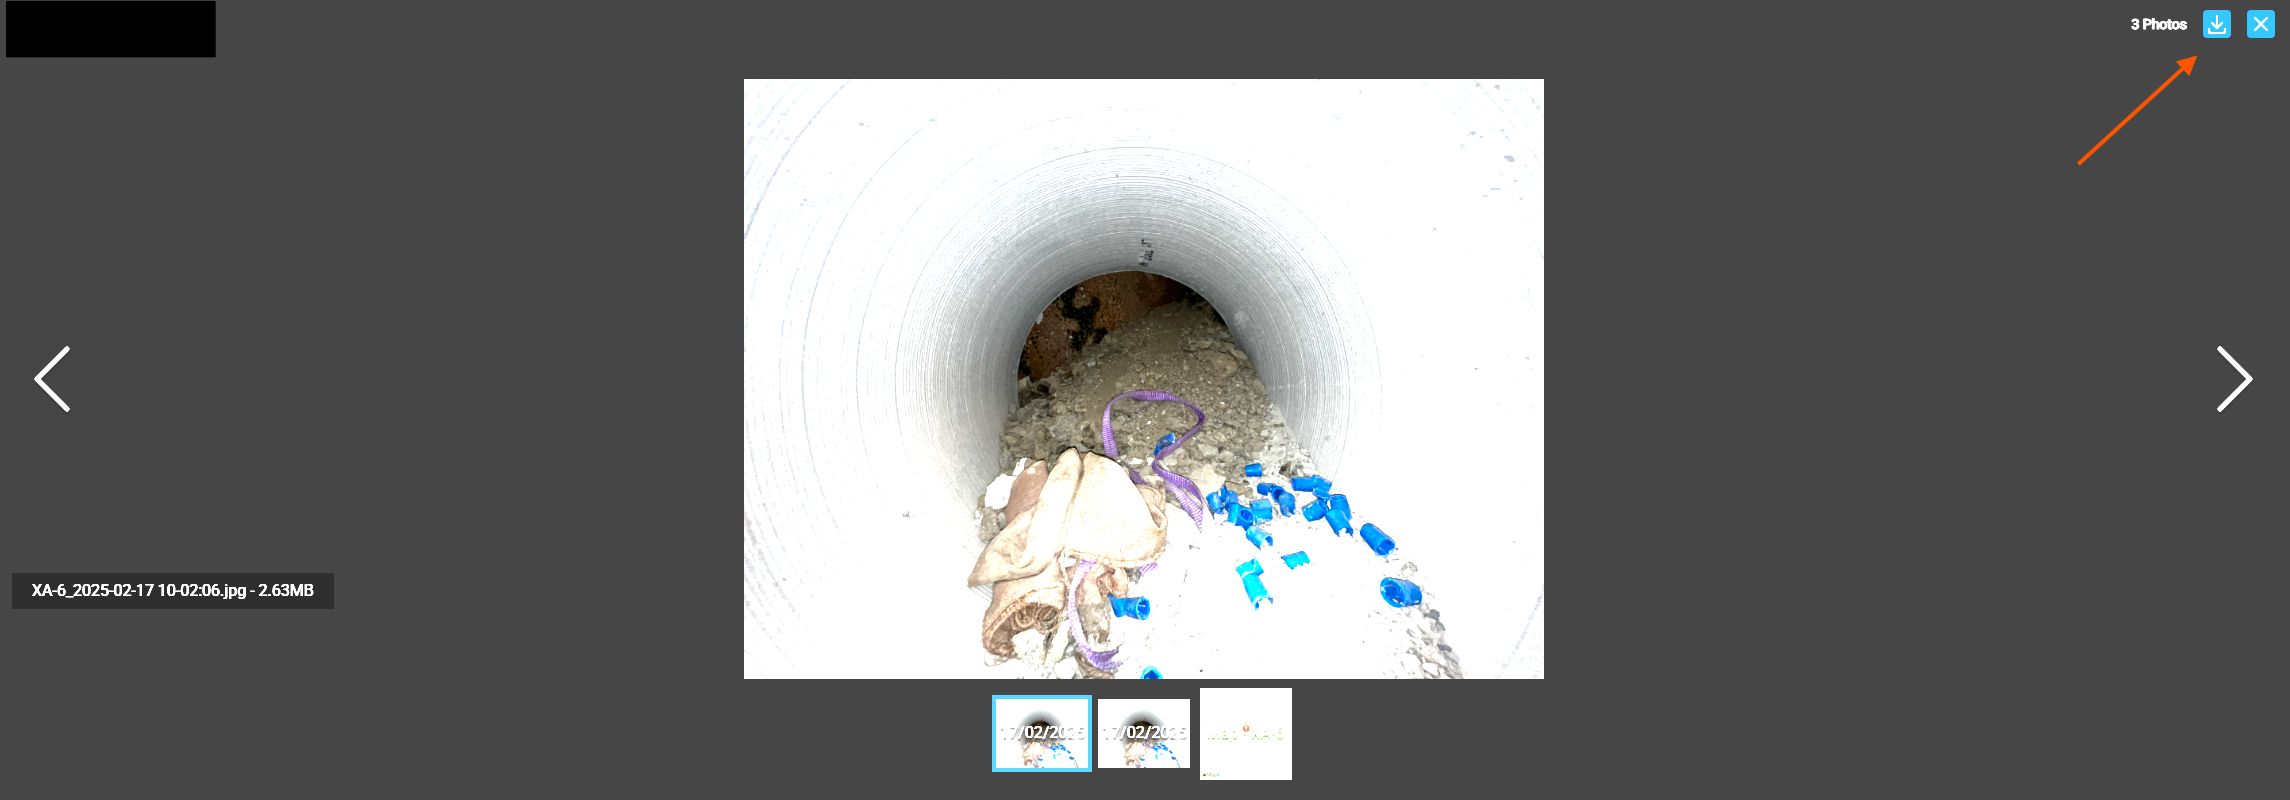
¶ View Linked Photos
Within View Linked Photos we can view all photos linked to the System Asset. We can download individual images from here utilising the download button in the top right corner.
¶ Pit Inspections - TBC
Data → Pit Inspections

Pit Inspections consists of summarised information around inspections, as well as map links and reports for inspected pits.
From this page we're able to export Data, Shapefiles, and Pit Reports (Max 50).

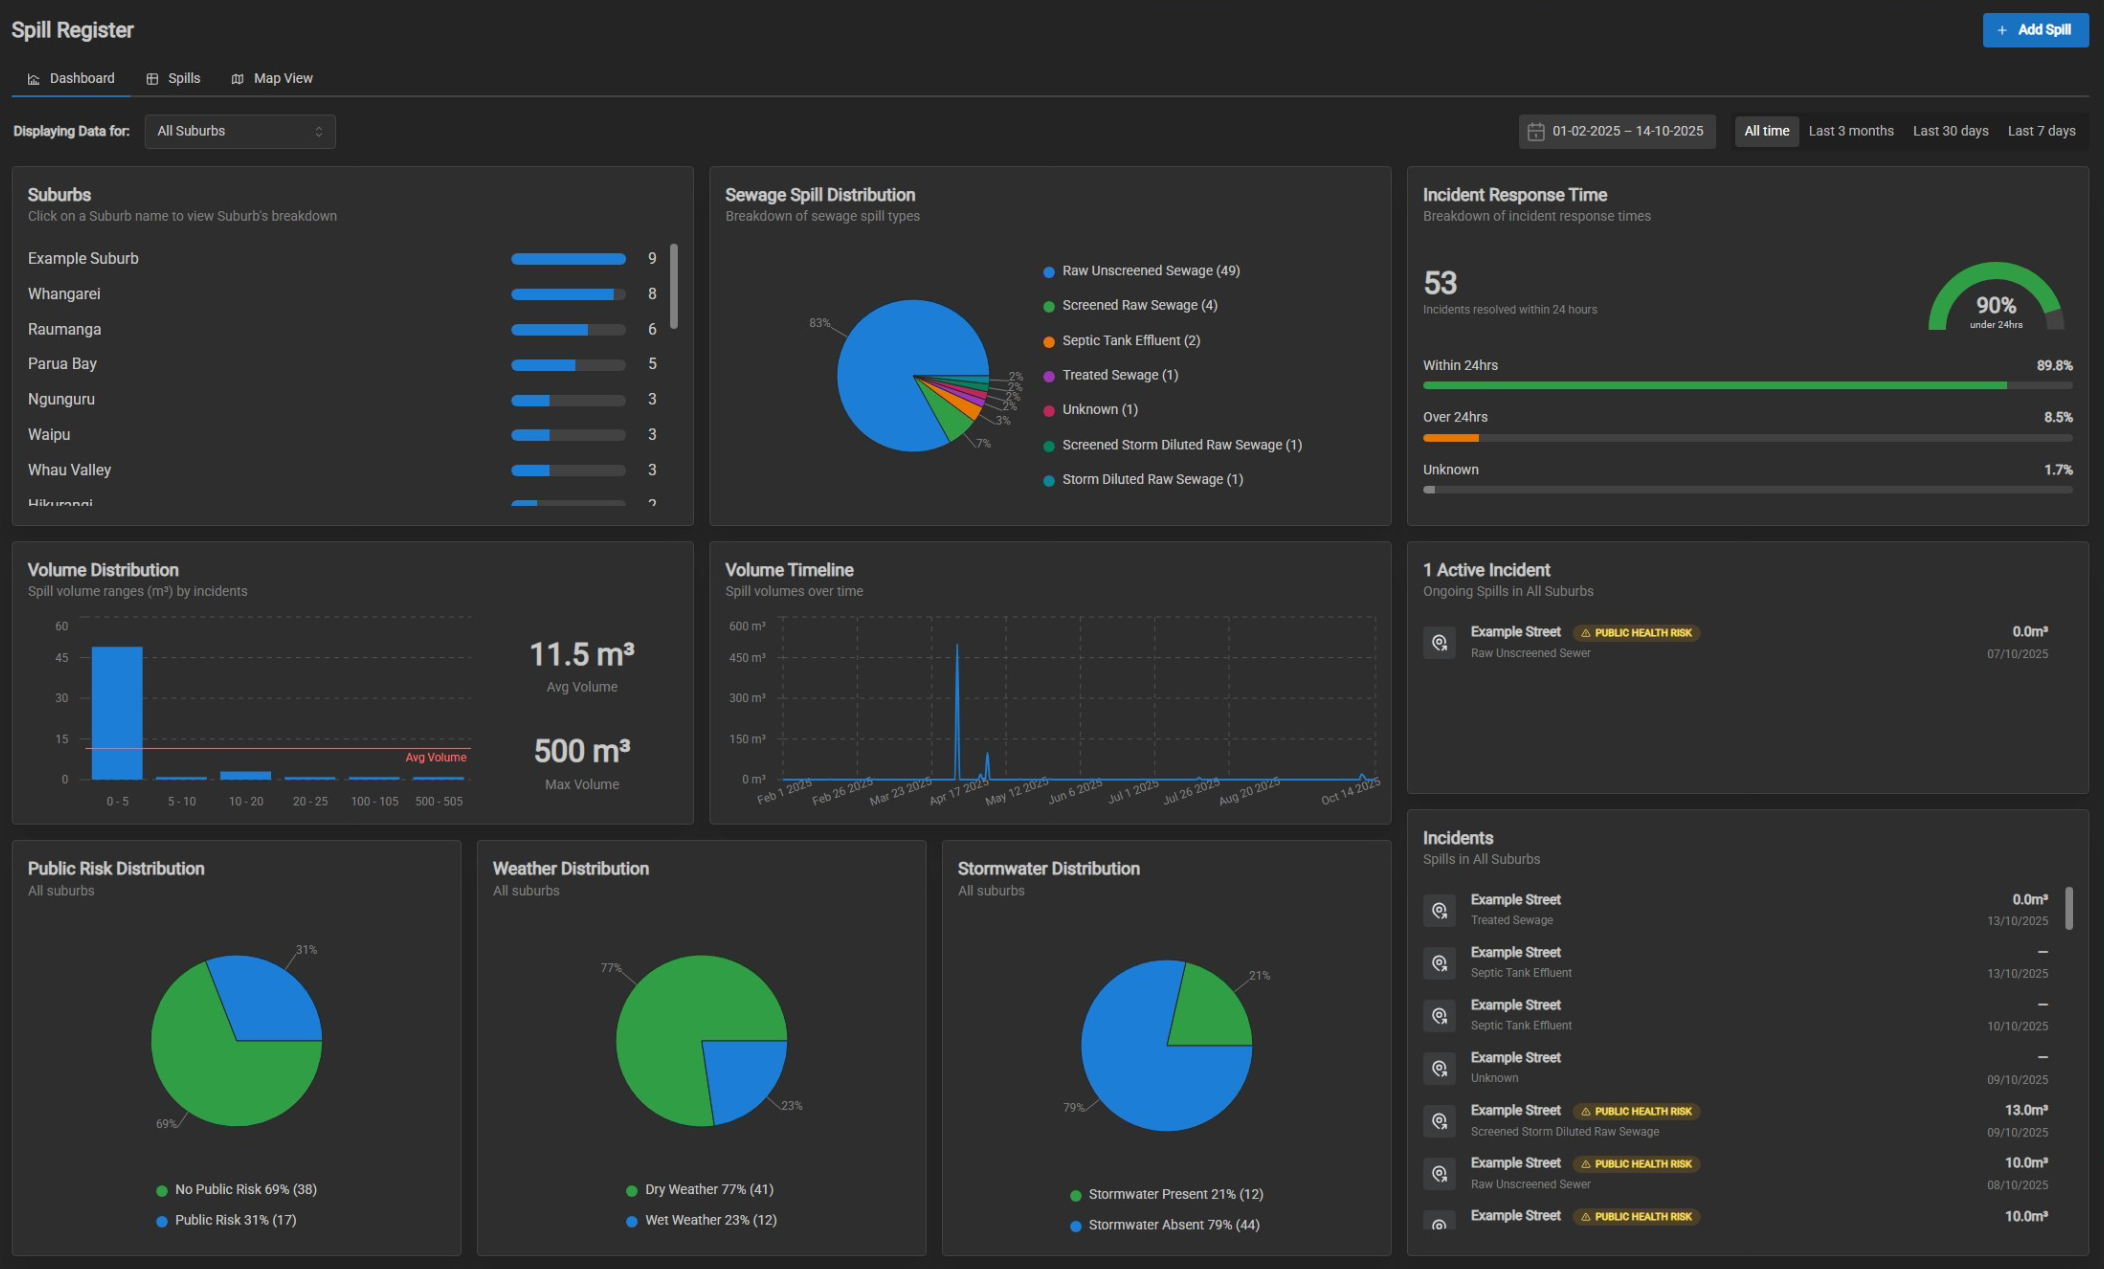
¶ Spill Register - WIP
Data → Spill Register
For more in-depth information on the Spills Register, follow the bellow link:
¶ How to Access the Spill Register
Your user account must have access to the Whangarei District Council (Sewer) in order to view the Spill Register. Once you have access, you should see the menu option "Spill Register" within the Data menu.
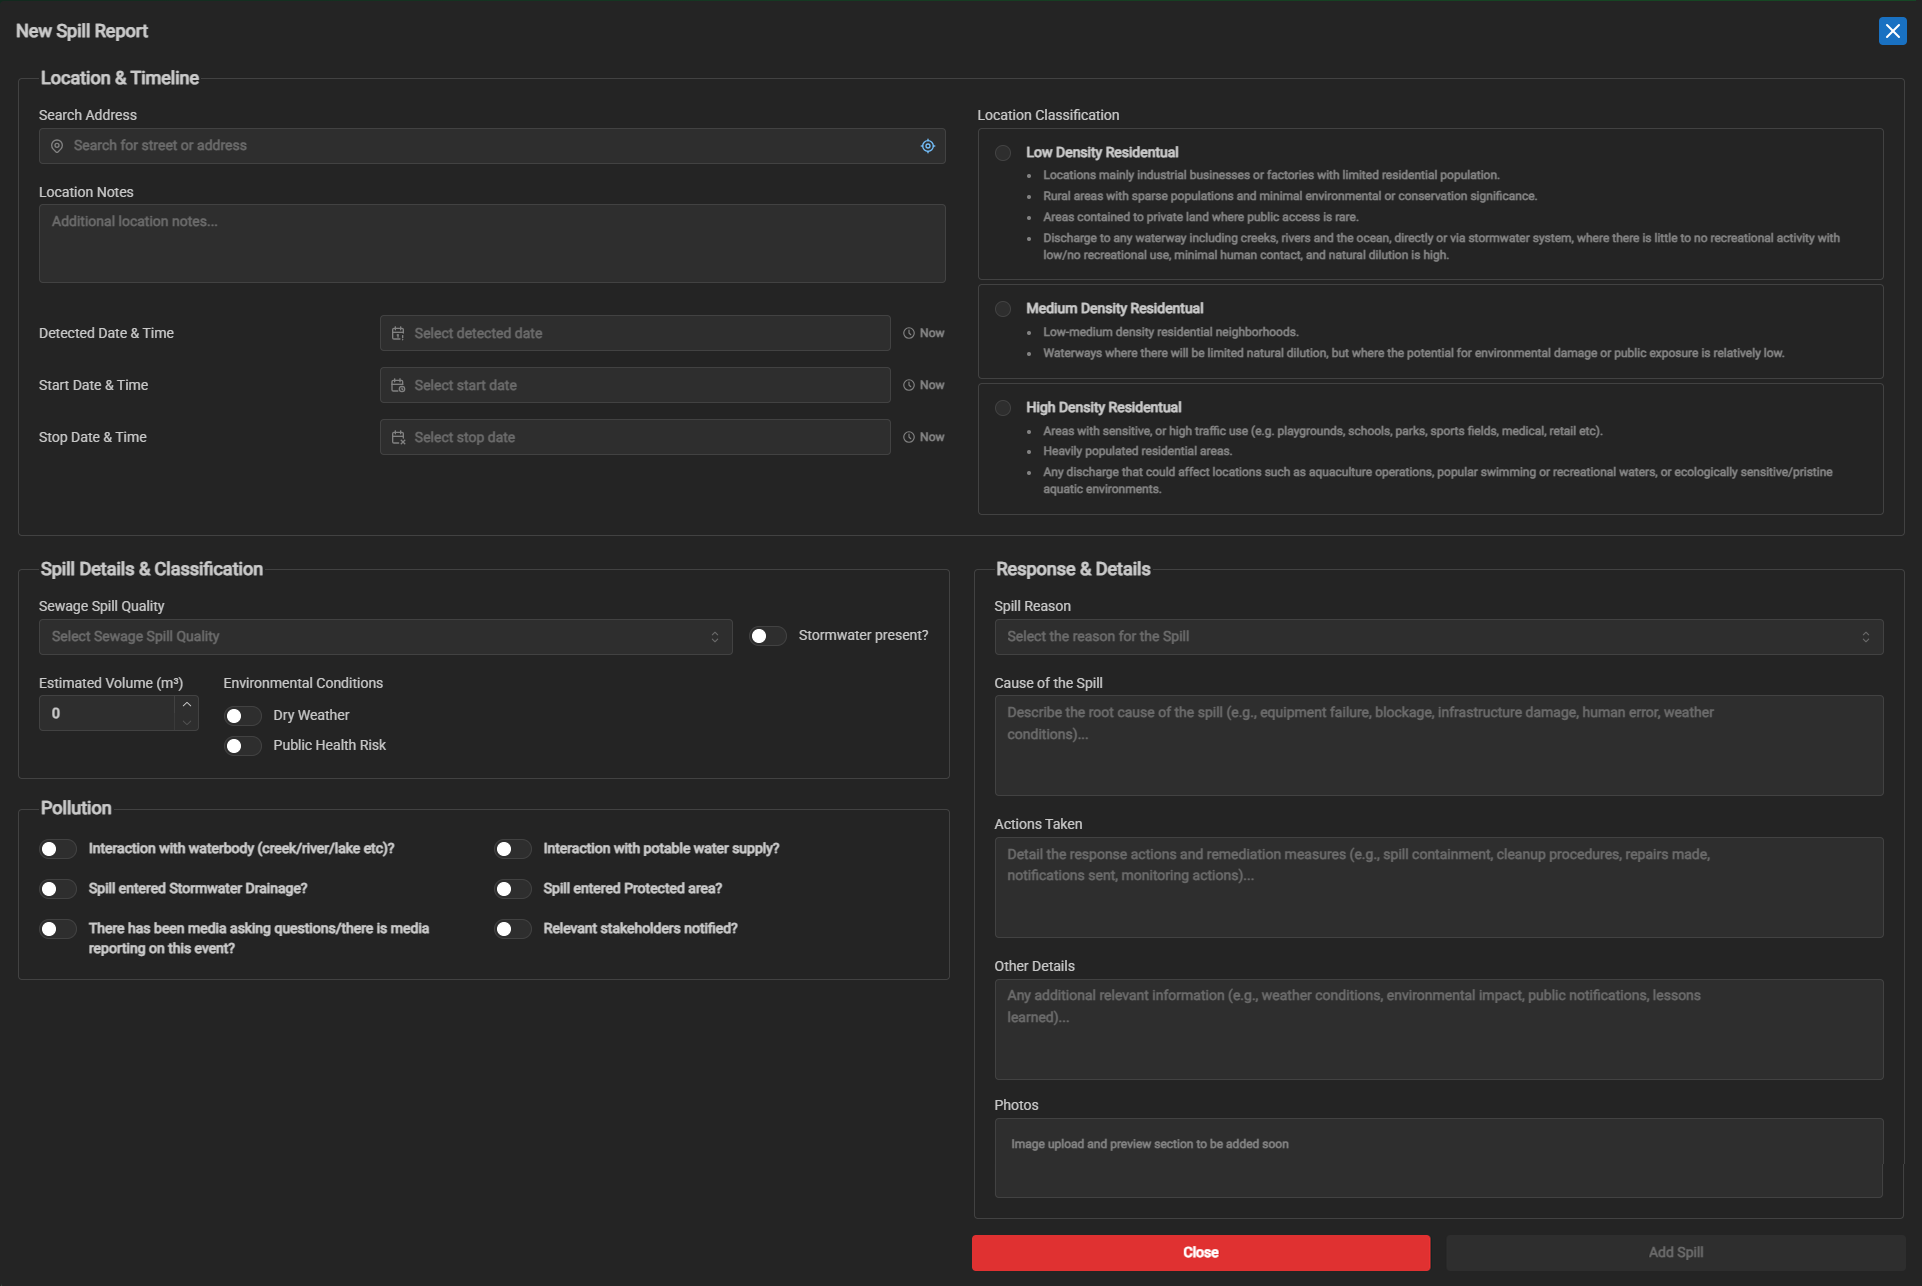
¶ Adding a new Spill
Adding a new spill can be done through the Spill Register and clicking on the Top Right Hand Button "Add Spill".
Clicking on this will open a Modal window with a form ready to be filled. Once the form field has been filled (more information the better for Dashboard metrics to be viewed), click on the Add Spill Button on the Bottom Right Side of the Modal window.
¶ GPT Jobs
Data → GPT Jobs
This section is for the viewing and export of GPT Jobs.
¶ Potholes
Data → Potholes

This section is for the viewing and download of Pothole reports (available in XLS as well).
¶ Documents
Data → Documents
This section consists of documents provided to UtilityTrack, examples are plans and mud maps.

From left to right we have: View File | Download File | Edit Plan | Delete Plan
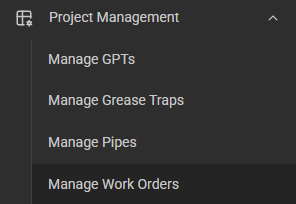
¶ Project Management
¶ Manage GPTs ~ COMING SOON
Project Management → Manage GPTs
¶ Manage Grease Traps ~ COMING SOON
Project Management → Grease Traps
¶ Manage Pipes ~ COMING SOON
Project Management → Manage Pipes
¶ Manage Work Orders
Project Management → Manage Work Orders
This section is where we can add Work Orders, and edit existing ones.
¶ Manage Rehab Treatments
Project Management → Rehab Treatments
This section displays the currently added Rehab treatement types, as well as provides the option to create new treatment types.
¶ External Uploads
Project Management → External Uploads
Here we are able to upload Wincan Projects manually.
¶ File Browser
Project Management → File Browser
Within File Browser we are able to explore every fleet vehicle that has uploaded into UT in the past and present. We can download project files if need be from this screen.
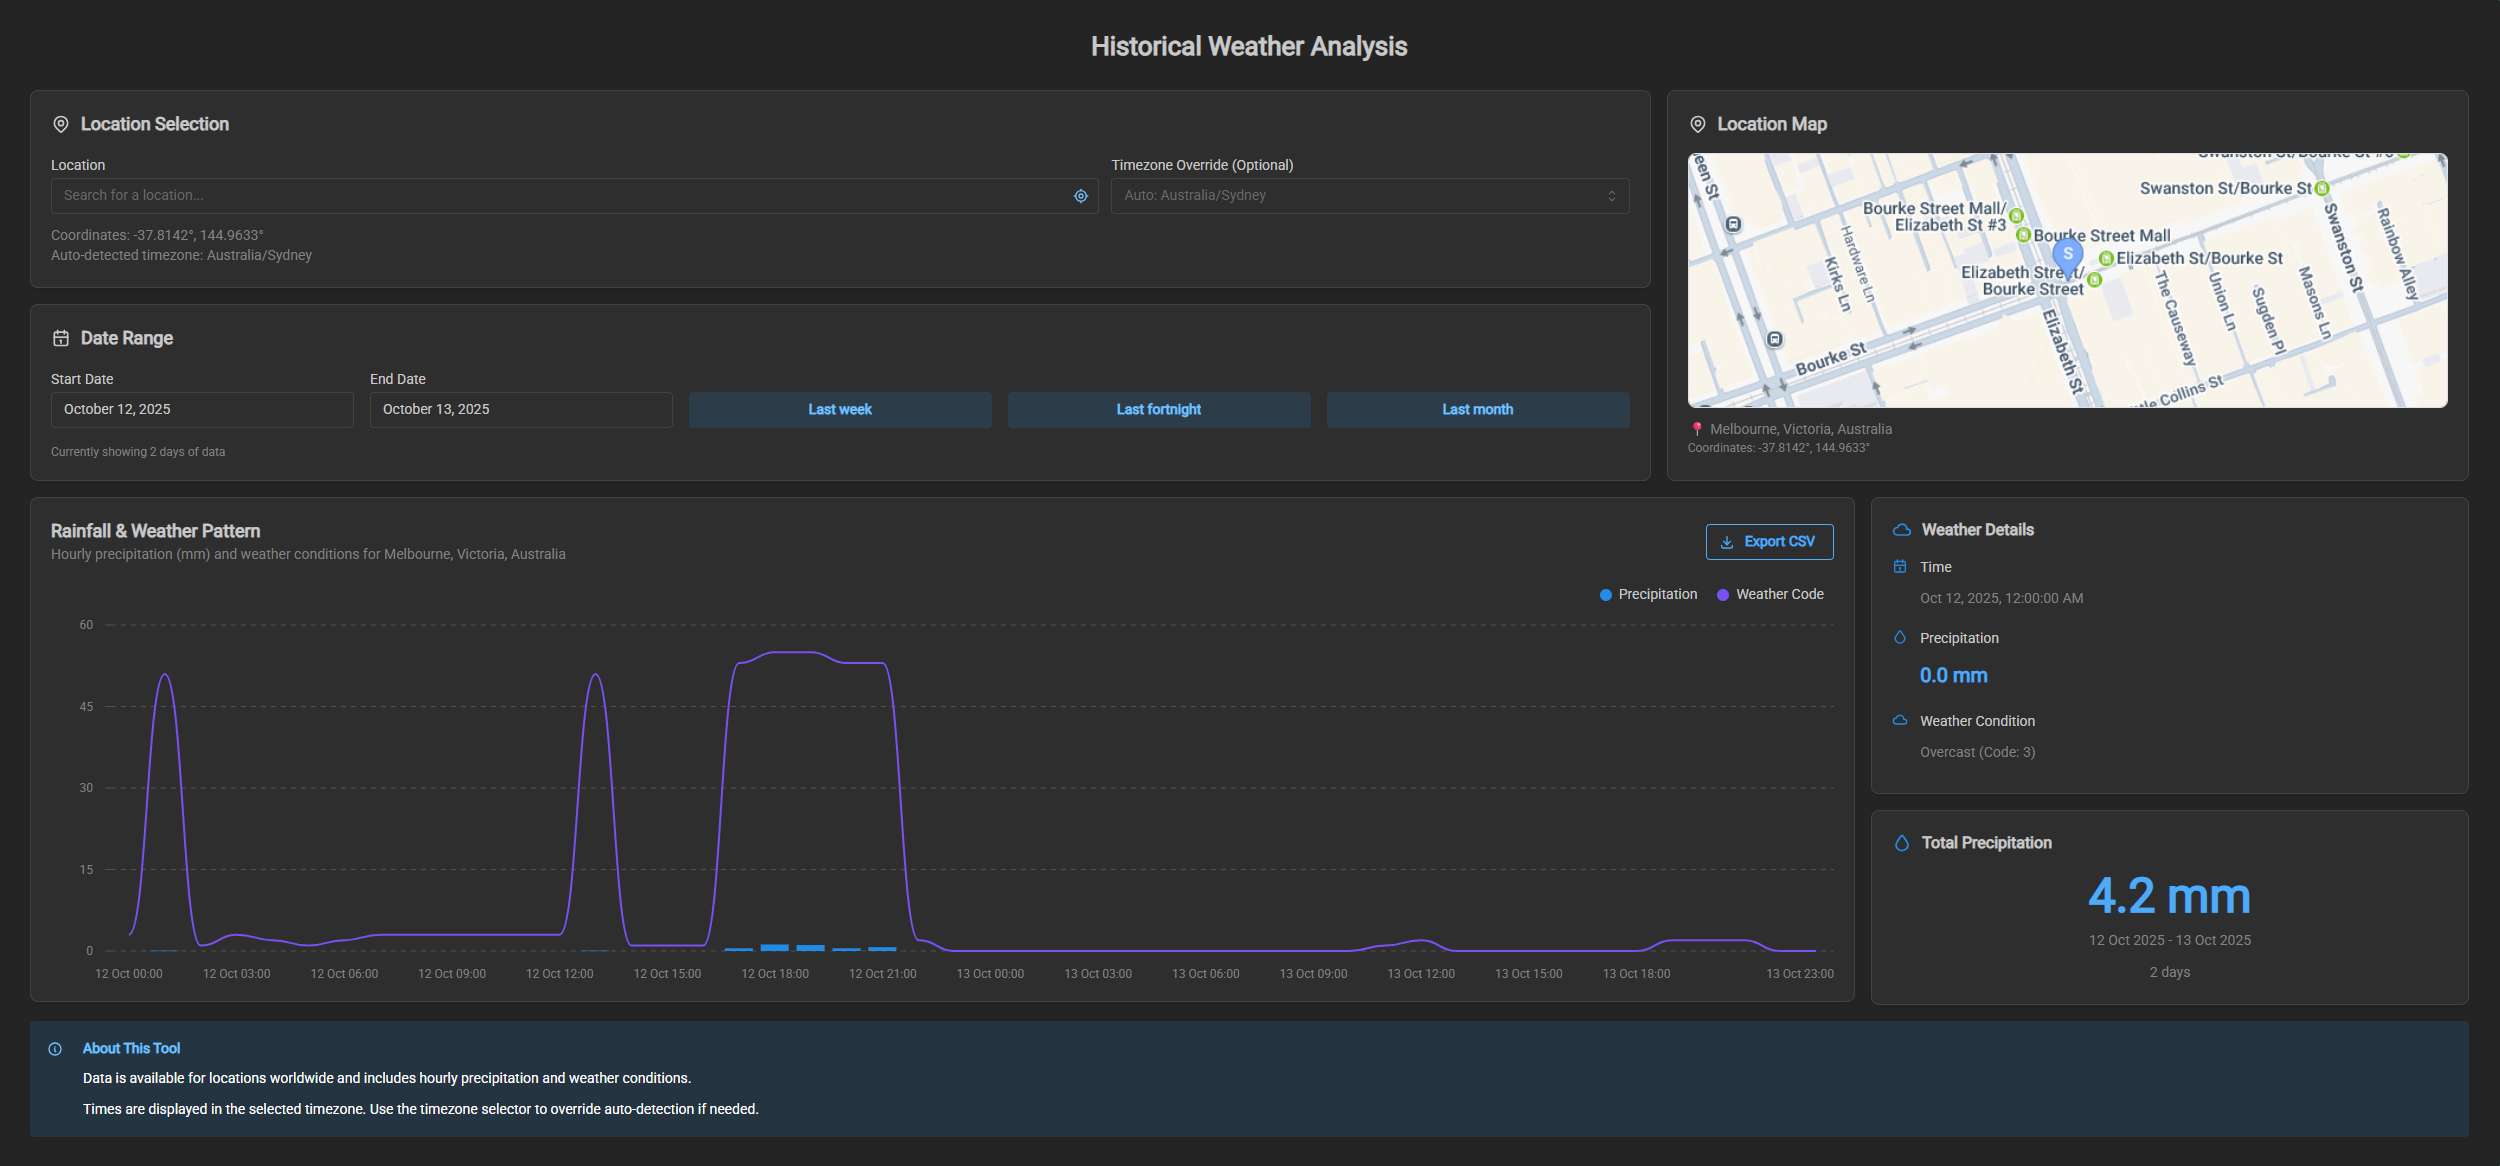
¶ Tools
¶ Weather Analysis
This tool allows you to get a quick analysis of the weather and rainfall experienced in an area over a set period of time. Examples of this are 5.9mm of precipitation over the last 6 days.
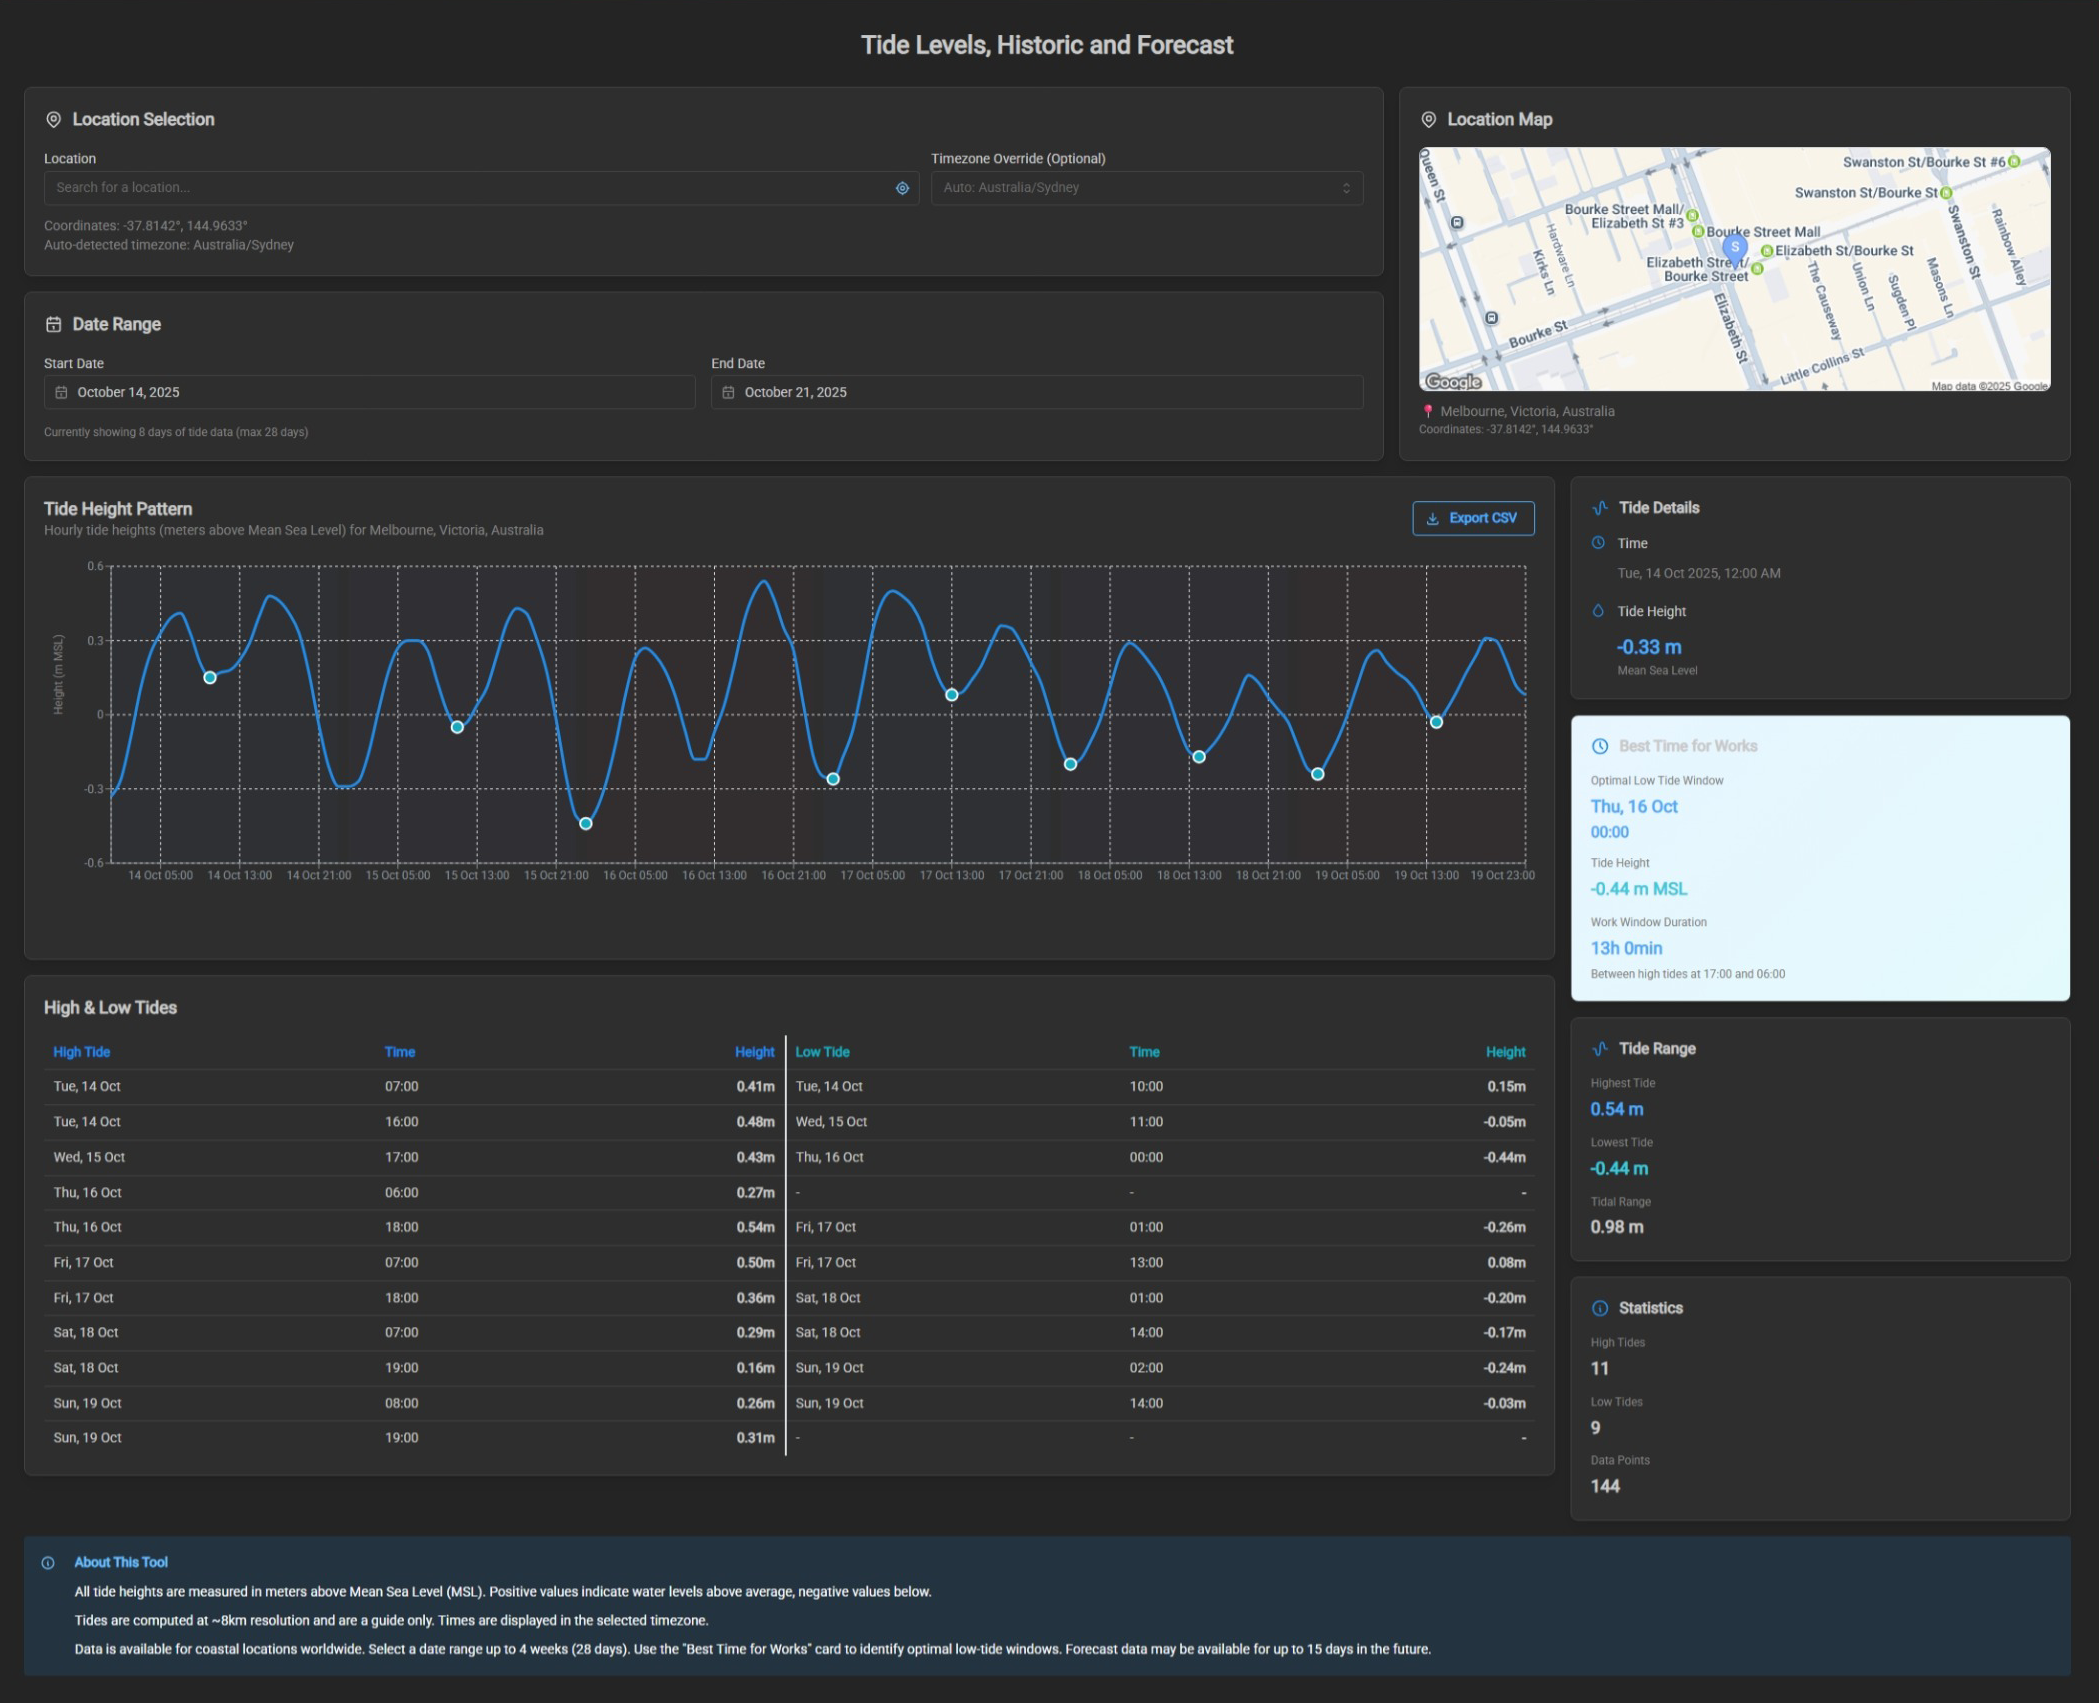
¶ Tide Analysis
This tool provides an overview of past and future Tide levels, suggesting the best time for works considering tidal heights, and the window of works possible. This can be configured based on location and time frame.